|
Download Data (XLS File) |
|
||||||||
|
||||||||
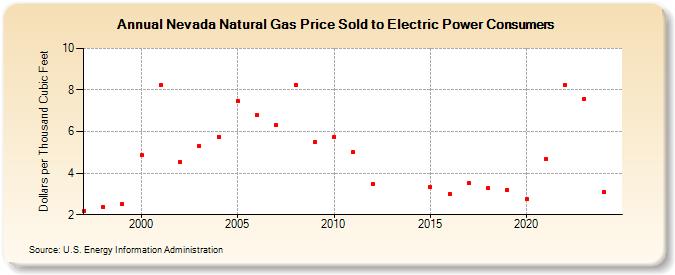
| Nevada Natural Gas Price Sold to Electric Power Consumers (Dollars per Thousand Cubic Feet) | ||||||||
| Decade | Year-0 | Year-1 | Year-2 | Year-3 | Year-4 | Year-5 | Year-6 | Year-7 | Year-8 | Year-9 |
|---|---|---|---|---|---|---|---|---|---|---|
| 1990's | 2.18 | 2.38 | 2.51 | |||||||
| 2000's | 4.86 | 8.22 | 4.53 | 5.31 | 5.76 | 7.46 | 6.79 | 6.31 | 8.26 | 5.50 |
| 2010's | 5.75 | 5.00 | 3.49 | W | W | 3.34 | 3.02 | 3.51 | 3.28 | 3.20 |
| 2020's | 2.75 | 4.68 | 8.25 | 7.56 | 3.11 | 3.59 |
| - = No Data Reported; -- = Not Applicable; NA = Not Available; W = Withheld to avoid disclosure of individual company data. |
| Release Date: 6/30/2026 |
| Next Release Date: 7/31/2026 |