|
Download Data (XLS File) |
|
||||||||
|
||||||||
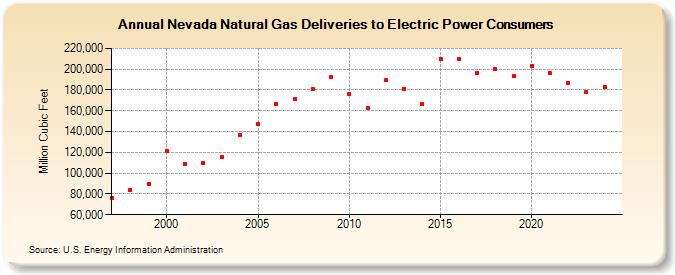
| Nevada Natural Gas Deliveries to Electric Power Consumers (Million Cubic Feet) | ||||||||
| Decade | Year-0 | Year-1 | Year-2 | Year-3 | Year-4 | Year-5 | Year-6 | Year-7 | Year-8 | Year-9 |
|---|---|---|---|---|---|---|---|---|---|---|
| 1990's | 75,656 | 84,093 | 89,954 | |||||||
| 2000's | 121,054 | 108,510 | 109,605 | 115,960 | 136,945 | 147,743 | 166,867 | 171,473 | 180,668 | 192,049 |
| 2010's | 175,837 | 162,778 | 189,291 | 181,326 | 166,727 | 209,692 | 209,901 | 196,541 | 199,840 | 193,172 |
| 2020's | 203,186 | 195,995 | 187,157 | 177,984 | 182,674 | 167,702 |
| - = No Data Reported; -- = Not Applicable; NA = Not Available; W = Withheld to avoid disclosure of individual company data. |
| Release Date: 6/30/2026 |
| Next Release Date: 7/31/2026 |