|
Download Data (XLS File) |
|
||||||||
|
||||||||
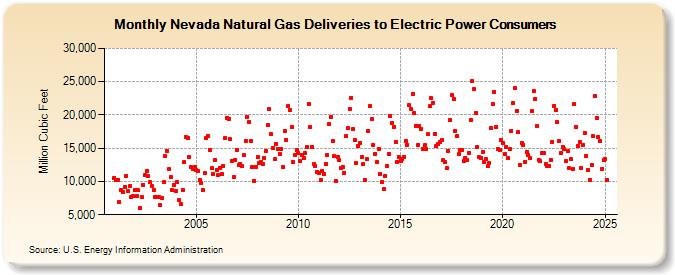
| Nevada Natural Gas Deliveries to Electric Power Consumers (Million Cubic Feet) | ||||||||
| Year | Jan | Feb | Mar | Apr | May | Jun | Jul | Aug | Sep | Oct | Nov | Dec |
|---|---|---|---|---|---|---|---|---|---|---|---|---|
| 2001 | 10,583 | 10,261 | 10,271 | 6,926 | 8,715 | 8,399 | 9,156 | 10,878 | 8,520 | 9,264 | 7,698 | 7,837 |
| 2002 | 8,690 | 7,845 | 8,650 | 5,974 | 7,672 | 9,532 | 10,965 | 11,631 | 10,763 | 9,859 | 9,317 | 8,707 |
| 2003 | 7,604 | 7,622 | 7,633 | 6,427 | 7,558 | 9,885 | 13,857 | 14,648 | 11,903 | 10,672 | 8,648 | 9,503 |
| 2004 | 8,546 | 9,853 | 7,203 | 6,595 | 8,714 | 12,911 | 16,687 | 16,518 | 13,687 | 12,106 | 11,938 | 12,187 |
| 2005 | 11,741 | 11,563 | 10,278 | 9,699 | 8,716 | 11,215 | 16,503 | 16,868 | 14,753 | 11,965 | 11,183 | 13,261 |
| 2006 | 11,725 | 11,020 | 11,955 | 11,087 | 12,372 | 16,470 | 19,581 | 19,340 | 16,314 | 13,047 | 10,709 | 13,247 |
| 2007 | 14,741 | 12,499 | 12,654 | 12,271 | 13,916 | 16,109 | 19,672 | 18,929 | 16,143 | 12,213 | 10,135 | 12,189 |
| 2008 | 13,714 | 12,751 | 12,949 | 12,632 | 13,571 | 14,626 | 18,414 | 20,879 | 17,118 | 15,060 | 13,320 | 15,634 |
| 2009 | 14,917 | 14,142 | 14,916 | 12,228 | 17,647 | 16,294 | 21,375 | 20,704 | 18,232 | 12,928 | 13,962 | 14,702 |
| 2010 | 14,216 | 13,053 | 14,025 | 13,468 | 14,274 | 15,230 | 21,674 | 18,189 | 15,224 | 12,620 | 12,374 | 11,491 |
| 2011 | 11,332 | 10,267 | 11,642 | 11,093 | 12,596 | 13,945 | 18,626 | 19,657 | 16,067 | 13,829 | 10,010 | 13,713 |
| 2012 | 13,180 | 12,062 | 12,107 | 11,342 | 16,874 | 17,965 | 20,959 | 22,608 | 17,863 | 16,263 | 12,758 | 15,311 |
| 2013 | 15,764 | 13,657 | 12,553 | 10,285 | 13,350 | 17,587 | 21,341 | 19,347 | 15,472 | 14,176 | 12,878 | 14,917 |
| 2014 | 11,091 | 9,986 | 8,888 | 10,865 | 12,254 | 14,199 | 19,844 | 18,769 | 18,219 | 15,912 | 12,978 | 13,724 |
| 2015 | 13,145 | 13,405 | 13,635 | 16,108 | 15,544 | 21,420 | 20,918 | 23,127 | 20,339 | 18,276 | 15,460 | 18,315 |
| 2016 | 17,928 | 14,835 | 15,431 | 14,884 | 17,080 | 21,280 | 22,524 | 21,862 | 17,165 | 15,312 | 15,676 | 15,924 |
| 2017 | 16,201 | 13,184 | 12,852 | 11,960 | 14,568 | 19,238 | 22,924 | 22,362 | 17,604 | 16,809 | 14,055 | 14,784 |
| 2018 | 14,748 | 13,050 | 13,553 | 13,244 | 14,330 | 19,281 | 25,113 | 23,829 | 20,338 | 15,190 | 13,661 | 13,504 |
| 2019 | 14,501 | 12,978 | 13,389 | 12,337 | 12,740 | 18,012 | 21,706 | 23,476 | 18,236 | 14,877 | 14,706 | 16,213 |
| 2020 | 15,804 | 14,095 | 15,175 | 13,530 | 14,827 | 17,632 | 21,807 | 24,034 | 20,614 | 17,393 | 12,541 | 15,736 |
| 2021 | 15,530 | 12,949 | 14,431 | 14,012 | 13,510 | 20,541 | 23,600 | 22,418 | 18,398 | 13,271 | 13,002 | 14,333 |
| 2022 | 14,220 | 12,567 | 12,373 | 12,316 | 13,204 | 15,957 | 21,344 | 20,708 | 18,935 | 16,053 | 14,279 | 15,199 |
| 2023 | 14,819 | 13,066 | 14,576 | 11,961 | 13,369 | 11,788 | 21,563 | 18,038 | 15,333 | 15,920 | 12,054 | 15,498 |
| 2024 | 17,340 | 13,865 | 11,764 | 10,345 | 12,552 | 16,772 | 22,758 | 19,484 | 16,692 | 16,023 | 11,880 | 13,199 |
| 2025 | 13,291 | 10,265 | 10,974 | 10,175 | 13,520 | 16,743 | 17,896 | 19,257 | 16,319 | 13,043 | 12,346 | 13,872 |
| 2026 | 15,471 | 12,556 | 13,593 | 10,935 | ||||||||
| - = No Data Reported; -- = Not Applicable; NA = Not Available; W = Withheld to avoid disclosure of individual company data. |
| Release Date: 6/30/2026 |
| Next Release Date: 7/31/2026 |