|
Download Data (XLS File) |
|
||||||||
|
||||||||
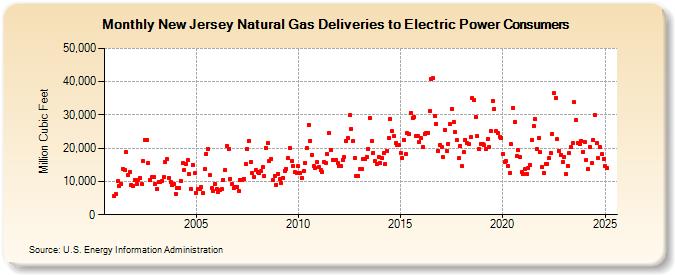
| New Jersey Natural Gas Deliveries to Electric Power Consumers (Million Cubic Feet) | ||||||||
| Year | Jan | Feb | Mar | Apr | May | Jun | Jul | Aug | Sep | Oct | Nov | Dec |
|---|---|---|---|---|---|---|---|---|---|---|---|---|
| 2001 | 5,662 | 6,141 | 9,997 | 8,697 | 9,177 | 13,768 | 13,532 | 18,799 | 11,986 | 12,925 | 9,013 | 8,681 |
| 2002 | 10,379 | 9,313 | 10,547 | 11,159 | 9,236 | 16,110 | 22,580 | 22,412 | 15,609 | 10,334 | 11,207 | 11,476 |
| 2003 | 9,174 | 7,854 | 9,919 | 9,975 | 10,237 | 11,330 | 15,780 | 16,693 | 11,122 | 9,833 | 8,868 | 9,346 |
| 2004 | 6,357 | 7,934 | 7,977 | 10,275 | 15,451 | 13,500 | 15,358 | 16,351 | 12,208 | 7,784 | 15,033 | 12,435 |
| 2005 | 6,605 | 7,737 | 7,825 | 8,304 | 6,523 | 13,737 | 18,344 | 19,903 | 11,807 | 7,982 | 7,055 | 9,277 |
| 2006 | 7,842 | 6,847 | 7,577 | 7,685 | 10,571 | 13,402 | 20,728 | 19,700 | 10,851 | 9,098 | 7,902 | 8,461 |
| 2007 | 8,411 | 7,169 | 10,366 | 10,311 | 10,816 | 15,124 | 19,760 | 22,278 | 15,885 | 12,425 | 11,368 | 13,462 |
| 2008 | 12,747 | 12,463 | 12,993 | 14,320 | 11,576 | 20,165 | 21,538 | 16,076 | 16,830 | 10,353 | 11,780 | 9,013 |
| 2009 | 12,363 | 10,637 | 9,475 | 11,163 | 13,246 | 13,832 | 16,978 | 20,121 | 16,201 | 14,697 | 12,692 | 12,682 |
| 2010 | 14,530 | 12,593 | 11,080 | 13,172 | 15,679 | 20,144 | 27,075 | 22,183 | 18,061 | 14,545 | 14,170 | 15,826 |
| 2011 | 14,291 | 13,352 | 12,901 | 15,881 | 15,689 | 18,249 | 24,519 | 19,592 | 16,529 | 16,432 | 16,504 | 15,657 |
| 2012 | 14,665 | 14,497 | 16,478 | 17,258 | 22,292 | 22,956 | 29,859 | 25,873 | 22,087 | 17,093 | 11,646 | 11,765 |
| 2013 | 13,721 | 13,867 | 16,823 | 16,749 | 17,363 | 19,857 | 29,210 | 22,081 | 18,640 | 16,061 | 15,283 | 17,378 |
| 2014 | 15,678 | 17,140 | 18,515 | 15,117 | 19,254 | 23,065 | 28,822 | 25,134 | 23,557 | 21,511 | 20,861 | 21,023 |
| 2015 | 18,699 | 17,073 | 22,460 | 18,113 | 24,482 | 24,137 | 30,696 | 29,196 | 29,315 | 23,585 | 23,683 | 22,007 |
| 2016 | 22,939 | 20,351 | 24,328 | 24,493 | 24,677 | 31,226 | 40,703 | 40,967 | 29,728 | 27,406 | 19,267 | 20,898 |
| 2017 | 20,453 | 17,244 | 25,542 | 19,107 | 21,366 | 27,193 | 31,871 | 27,969 | 24,790 | 22,428 | 16,931 | 20,760 |
| 2018 | 14,497 | 18,773 | 22,598 | 21,481 | 21,210 | 23,216 | 34,987 | 34,549 | 29,346 | 23,624 | 19,697 | 21,319 |
| 2019 | 21,310 | 20,845 | 19,815 | 22,793 | 20,324 | 25,107 | 34,282 | 31,751 | 25,095 | 24,491 | 23,369 | 23,192 |
| 2020 | 18,367 | 15,918 | 16,144 | 14,625 | 12,570 | 21,165 | 32,227 | 27,992 | 17,601 | 19,446 | 17,354 | 12,767 |
| 2021 | 12,254 | 13,624 | 12,358 | 13,982 | 15,077 | 22,563 | 26,716 | 28,766 | 19,655 | 23,017 | 18,743 | 14,399 |
| 2022 | 12,624 | 15,325 | 15,303 | 16,942 | 18,616 | 24,407 | 36,440 | 35,165 | 22,672 | 19,121 | 18,093 | 15,795 |
| 2023 | 16,742 | 11,791 | 14,712 | 19,210 | 19,536 | 20,319 | 34,505 | 27,800 | 20,938 | 21,707 | 21,815 | 18,020 |
| 2024 | 20,705 | 15,601 | 12,931 | 20,082 | 14,914 | 21,827 | 29,471 | 20,516 | 15,544 | 19,382 | 17,352 | 15,540 |
| 2025 | 13,543 | 13,147 | 12,536 | 20,796 | 13,702 | 21,044 | 32,762 | 23,708 | 18,914 | 21,562 | 17,211 | 17,824 |
| 2026 | 14,565 | 19,985 | 16,013 | 18,868 | ||||||||
| - = No Data Reported; -- = Not Applicable; NA = Not Available; W = Withheld to avoid disclosure of individual company data. |
| Release Date: 6/30/2026 |
| Next Release Date: 7/31/2026 |