|
Download Data (XLS File) |
|
||||||||
|
||||||||
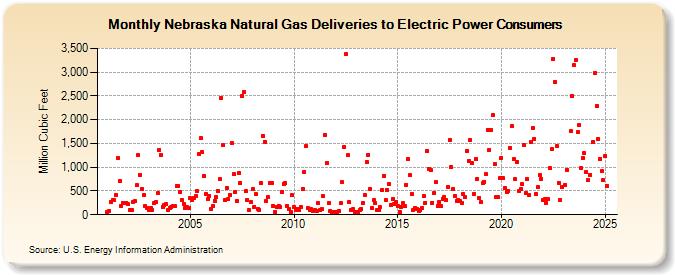
| Nebraska Natural Gas Deliveries to Electric Power Consumers (Million Cubic Feet) | ||||||||
| Year | Jan | Feb | Mar | Apr | May | Jun | Jul | Aug | Sep | Oct | Nov | Dec |
|---|---|---|---|---|---|---|---|---|---|---|---|---|
| 2001 | 60 | 81 | 270 | 310 | 302 | 422 | 1,201 | 701 | 185 | 252 | 250 | 256 |
| 2002 | 220 | 89 | 93 | 269 | 283 | 618 | 1,251 | 842 | 548 | 413 | 175 | 145 |
| 2003 | 97 | 141 | 104 | 236 | 263 | 447 | 1,371 | 1,264 | 164 | 197 | 218 | 92 |
| 2004 | 145 | 159 | 179 | 176 | 606 | 603 | 487 | 314 | 231 | 150 | 152 | 138 |
| 2005 | 344 | 303 | 355 | 389 | 496 | 1,268 | 1,606 | 1,316 | 818 | 440 | 329 | 403 |
| 2006 | 123 | 185 | 298 | 379 | 503 | 742 | 2,463 | 1,465 | 314 | 564 | 334 | 417 |
| 2007 | 1,508 | 847 | 476 | 279 | 880 | 667 | 2,503 | 2,583 | 491 | 314 | 99 | 260 |
| 2008 | 532 | 171 | 428 | 129 | 109 | 657 | 1,664 | 1,537 | 288 | 371 | 670 | 675 |
| 2009 | 188 | 65 | 154 | 191 | 161 | 479 | 648 | 666 | 186 | 117 | 67 | 410 |
| 2010 | 163 | 104 | 128 | 90 | 165 | 544 | 902 | 1,436 | 139 | 96 | 112 | 71 |
| 2011 | 92 | 84 | 240 | 90 | 117 | 384 | 1,687 | 1,089 | 242 | 76 | 61 | 59 |
| 2012 | 58 | 54 | 87 | 241 | 681 | 1,422 | 3,376 | 1,250 | 267 | 90 | 115 | 55 |
| 2013 | 45 | 63 | 103 | 120 | 251 | 422 | 1,108 | 1,263 | 539 | 143 | 304 | 241 |
| 2014 | 99 | 90 | 152 | 517 | 821 | 305 | 527 | 642 | 212 | 326 | 222 | 277 |
| 2015 | 184 | 63 | 152 | 240 | 178 | 634 | 1,164 | 826 | 433 | 102 | 149 | 129 |
| 2016 | 88 | 103 | 150 | 389 | 257 | 1,344 | 961 | 931 | 257 | 452 | 679 | 180 |
| 2017 | 270 | 177 | 337 | 372 | 305 | 587 | 1,574 | 1,001 | 531 | 398 | 297 | 318 |
| 2018 | 282 | 250 | 439 | 367 | 1,349 | 1,125 | 1,573 | 1,082 | 437 | 1,172 | 762 | 357 |
| 2019 | 259 | 664 | 695 | 850 | 1,783 | 1,362 | 1,782 | 2,089 | 1,060 | 364 | 364 | 765 |
| 2020 | 1,200 | 765 | 565 | 487 | 504 | 1,407 | 1,857 | 1,162 | 745 | 1,111 | 498 | 537 |
| 2021 | 640 | 1,469 | 456 | 744 | 413 | 1,521 | 1,832 | 1,595 | 441 | 581 | 828 | 757 |
| 2022 | 311 | 324 | 255 | 324 | 976 | 1,377 | 3,286 | 2,798 | 1,440 | 673 | 309 | 592 |
| 2023 | 359 | 315 | 401 | 581 | 1,511 | 2,487 | 2,657 | 2,758 | 1,091 | 665 | 678 | 722 |
| 2024 | 1,021 | 351 | 483 | 666 | 1,345 | 1,630 | 2,785 | 2,578 | 1,149 | 937 | 392 | 405 |
| 2025 | 565 | 602 | W | 788 | 845 | 1,933 | 3,332 | 3,039 | 2,214 | 976 | 881 | W |
| 2026 | 823 | 704 | W | 1,149 | ||||||||
| - = No Data Reported; -- = Not Applicable; NA = Not Available; W = Withheld to avoid disclosure of individual company data. |
| Release Date: 6/30/2026 |
| Next Release Date: 7/31/2026 |