|
Download Data (XLS File) |
|
||||||||
|
||||||||
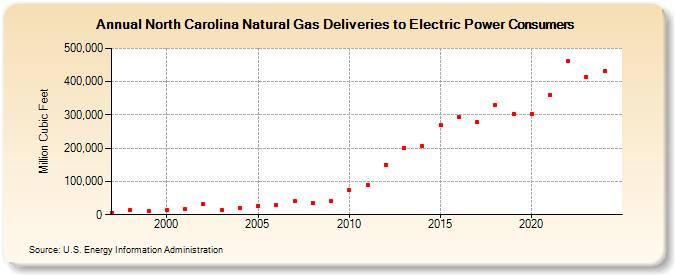
| North Carolina Natural Gas Deliveries to Electric Power Consumers (Million Cubic Feet) | ||||||||
| Decade | Year-0 | Year-1 | Year-2 | Year-3 | Year-4 | Year-5 | Year-6 | Year-7 | Year-8 | Year-9 |
|---|---|---|---|---|---|---|---|---|---|---|
| 1990's | 5,917 | 13,685 | 12,412 | |||||||
| 2000's | 12,942 | 16,247 | 31,877 | 14,350 | 21,423 | 27,009 | 28,374 | 40,154 | 35,963 | 39,916 |
| 2010's | 73,072 | 89,799 | 150,866 | 201,489 | 205,740 | 269,354 | 293,272 | 278,240 | 330,119 | 303,694 |
| 2020's | 303,361 | 360,804 | 463,449 | 399,988 | 430,803 | 417,717 |
| - = No Data Reported; -- = Not Applicable; NA = Not Available; W = Withheld to avoid disclosure of individual company data. |
| Release Date: 6/30/2026 |
| Next Release Date: 7/31/2026 |