|
Download Data (XLS File) |
|
||||||||
|
||||||||
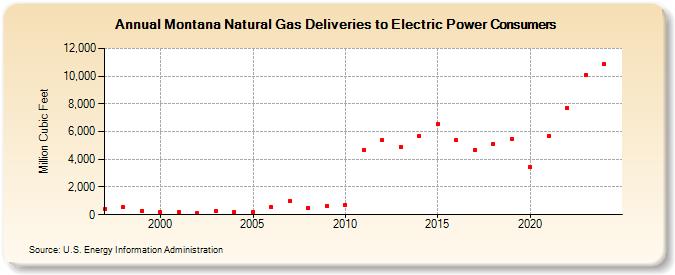
| Montana Natural Gas Deliveries to Electric Power Consumers (Million Cubic Feet) | ||||||||
| Decade | Year-0 | Year-1 | Year-2 | Year-3 | Year-4 | Year-5 | Year-6 | Year-7 | Year-8 | Year-9 |
|---|---|---|---|---|---|---|---|---|---|---|
| 1990's | 420 | 522 | 291 | |||||||
| 2000's | 192 | 161 | 116 | 259 | 195 | 213 | 544 | 1,000 | 513 | 656 |
| 2010's | 705 | 4,681 | 5,370 | 4,906 | 5,662 | 6,558 | 5,363 | 4,688 | 5,129 | 5,495 |
| 2020's | 3,426 | 5,693 | 7,729 | 10,309 | 9,933 | 12,539 |
| - = No Data Reported; -- = Not Applicable; NA = Not Available; W = Withheld to avoid disclosure of individual company data. |
| Release Date: 6/30/2026 |
| Next Release Date: 7/31/2026 |