|
Download Data (XLS File) |
|
||||||||
|
||||||||
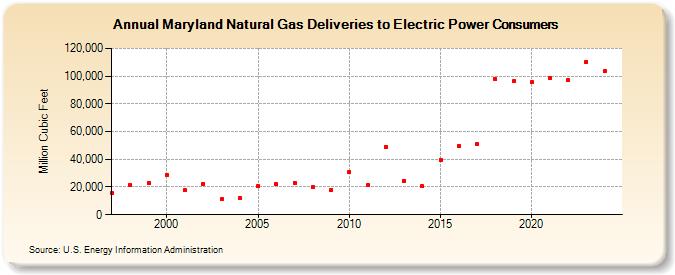
| Maryland Natural Gas Deliveries to Electric Power Consumers (Million Cubic Feet) | ||||||||
| Decade | Year-0 | Year-1 | Year-2 | Year-3 | Year-4 | Year-5 | Year-6 | Year-7 | Year-8 | Year-9 |
|---|---|---|---|---|---|---|---|---|---|---|
| 1990's | 15,524 | 21,515 | 22,842 | |||||||
| 2000's | 28,926 | 17,520 | 22,273 | 10,995 | 12,045 | 20,478 | 21,830 | 23,079 | 19,910 | 18,039 |
| 2010's | 30,728 | 21,136 | 49,211 | 24,556 | 20,403 | 39,770 | 49,486 | 50,725 | 97,671 | 96,274 |
| 2020's | 95,487 | 98,646 | 96,940 | 111,274 | 103,050 | 117,619 |
| - = No Data Reported; -- = Not Applicable; NA = Not Available; W = Withheld to avoid disclosure of individual company data. |
| Release Date: 6/30/2026 |
| Next Release Date: 7/31/2026 |