|
Download Data (XLS File) |
|
||||||||
|
||||||||
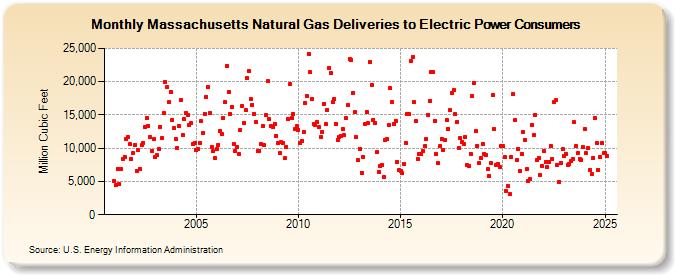
| Massachusetts Natural Gas Deliveries to Electric Power Consumers (Million Cubic Feet) | ||||||||
| Year | Jan | Feb | Mar | Apr | May | Jun | Jul | Aug | Sep | Oct | Nov | Dec |
|---|---|---|---|---|---|---|---|---|---|---|---|---|
| 2001 | 5,015 | 4,464 | 6,921 | 4,553 | 6,846 | 8,389 | 8,716 | 11,433 | 11,686 | 10,562 | 8,428 | 9,281 |
| 2002 | 10,482 | 6,633 | 9,702 | 6,925 | 10,459 | 10,846 | 13,254 | 14,505 | 13,386 | 11,693 | 9,628 | 11,339 |
| 2003 | 8,619 | 8,909 | 9,871 | 13,235 | 11,504 | 15,307 | 19,958 | 19,177 | 16,909 | 18,511 | 14,243 | 13,008 |
| 2004 | 11,387 | 10,037 | 13,270 | 17,193 | 12,018 | 14,359 | 15,301 | 15,055 | 13,553 | 13,727 | 10,649 | 10,851 |
| 2005 | 9,788 | 9,918 | 10,746 | 14,084 | 12,229 | 15,201 | 17,746 | 19,181 | 15,275 | 10,203 | 9,504 | 8,554 |
| 2006 | 9,873 | 10,515 | 12,512 | 12,088 | 14,552 | 16,900 | 22,422 | 18,502 | 15,139 | 16,173 | 10,683 | 9,611 |
| 2007 | 10,162 | 9,058 | 12,759 | 16,337 | 13,852 | 15,712 | 20,546 | 21,667 | 17,408 | 16,564 | 15,161 | 14,006 |
| 2008 | 9,557 | 9,632 | 10,703 | 13,339 | 10,420 | 15,016 | 20,026 | 14,346 | 13,264 | 13,131 | 13,675 | 11,876 |
| 2009 | 10,781 | 9,261 | 10,857 | 10,854 | 8,459 | 10,183 | 14,374 | 19,585 | 14,535 | 15,139 | 12,844 | 13,288 |
| 2010 | 12,740 | 10,732 | 11,152 | 12,507 | 16,778 | 17,839 | 24,214 | 21,399 | 17,385 | 13,633 | 13,539 | 13,925 |
| 2011 | 13,144 | 11,659 | 12,491 | 16,687 | 13,587 | 15,755 | 22,106 | 21,259 | 16,881 | 17,408 | 13,664 | 11,263 |
| 2012 | 11,614 | 11,812 | 12,937 | 11,942 | 14,515 | 16,520 | 23,375 | 23,234 | 18,343 | 15,423 | 11,707 | 8,177 |
| 2013 | 9,907 | 6,316 | 8,726 | 13,625 | 15,458 | 13,735 | 22,960 | 19,547 | 14,274 | 13,770 | 9,410 | 6,491 |
| 2014 | 7,304 | 7,518 | 5,715 | 11,199 | 11,372 | 13,430 | 18,972 | 16,923 | 13,601 | 14,158 | 7,955 | 6,710 |
| 2015 | 6,586 | 6,206 | 7,657 | 10,797 | 15,150 | 15,103 | 23,110 | 23,712 | 16,911 | 14,089 | 8,386 | 9,089 |
| 2016 | 9,082 | 9,526 | 10,265 | 11,333 | 15,038 | 17,082 | 21,487 | 21,402 | 14,109 | 9,112 | 7,743 | 10,256 |
| 2017 | 11,437 | 9,763 | 11,257 | 14,296 | 12,931 | 15,683 | 18,350 | 18,679 | 15,113 | 13,901 | 10,032 | 11,524 |
| 2018 | 10,938 | 10,576 | 11,667 | 7,424 | 7,301 | 9,180 | 17,816 | 19,753 | 12,540 | 10,301 | 7,713 | 8,503 |
| 2019 | 10,648 | 9,198 | 8,921 | 6,809 | 5,809 | 7,732 | 17,940 | 12,879 | 7,532 | 7,643 | 7,235 | 10,401 |
| 2020 | 10,286 | 8,663 | 3,634 | 4,270 | 3,087 | 8,701 | 18,109 | 14,177 | 8,158 | 9,904 | 6,545 | 9,185 |
| 2021 | 12,429 | 11,283 | 6,844 | 5,115 | 5,306 | 13,525 | 11,917 | 15,023 | 8,264 | 8,508 | 5,973 | 7,324 |
| 2022 | 9,566 | 7,998 | 7,227 | 7,868 | 10,311 | 8,313 | 16,916 | 17,204 | 7,496 | 4,977 | 7,741 | 9,815 |
| 2023 | 8,251 | 8,575 | 6,987 | 7,643 | 7,645 | 7,971 | 14,719 | 9,894 | 9,728 | 8,786 | 8,143 | 9,664 |
| 2024 | 12,029 | 8,477 | 9,203 | 6,103 | 5,687 | 8,456 | 16,757 | 11,697 | 7,225 | 11,238 | 11,832 | 9,409 |
| 2025 | 9,546 | 9,053 | 8,832 | 7,880 | 8,629 | 12,383 | 16,755 | 13,137 | 9,883 | 11,556 | 11,924 | 12,241 |
| 2026 | 10,857 | 8,503 | 6,101 | 7,237 | ||||||||
| - = No Data Reported; -- = Not Applicable; NA = Not Available; W = Withheld to avoid disclosure of individual company data. |
| Release Date: 6/30/2026 |
| Next Release Date: 7/31/2026 |