|
Download Data (XLS File) |
|
||||||||
|
||||||||
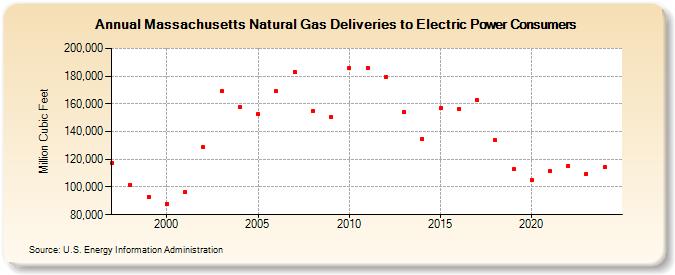
| Massachusetts Natural Gas Deliveries to Electric Power Consumers (Million Cubic Feet) | ||||||||
| Decade | Year-0 | Year-1 | Year-2 | Year-3 | Year-4 | Year-5 | Year-6 | Year-7 | Year-8 | Year-9 |
|---|---|---|---|---|---|---|---|---|---|---|
| 1990's | 117,259 | 101,682 | 93,126 | |||||||
| 2000's | 88,089 | 96,294 | 128,852 | 169,252 | 157,400 | 152,429 | 168,970 | 183,231 | 154,984 | 150,161 |
| 2010's | 185,842 | 185,903 | 179,598 | 154,217 | 134,858 | 156,795 | 156,433 | 162,967 | 133,711 | 112,746 |
| 2020's | 104,718 | 111,512 | 115,431 | 108,006 | 118,112 | 131,818 |
| - = No Data Reported; -- = Not Applicable; NA = Not Available; W = Withheld to avoid disclosure of individual company data. |
| Release Date: 6/30/2026 |
| Next Release Date: 7/31/2026 |