|
Download Data (XLS File) |
|
||||||||
|
||||||||
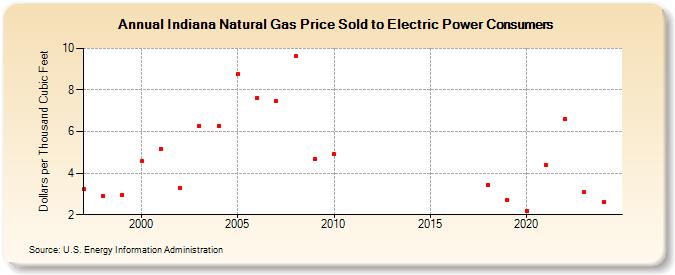
| Indiana Natural Gas Price Sold to Electric Power Consumers (Dollars per Thousand Cubic Feet) | ||||||||
| Decade | Year-0 | Year-1 | Year-2 | Year-3 | Year-4 | Year-5 | Year-6 | Year-7 | Year-8 | Year-9 |
|---|---|---|---|---|---|---|---|---|---|---|
| 1990's | 3.23 | 2.88 | 2.97 | |||||||
| 2000's | 4.56 | 5.18 | 3.28 | 6.29 | 6.26 | 8.76 | 7.63 | 7.48 | 9.61 | 4.69 |
| 2010's | 4.91 | W | W | W | W | W | W | W | 3.44 | 2.73 |
| 2020's | 2.16 | 4.40 | 6.62 | 3.03 | 2.61 | 3.93 |
| - = No Data Reported; -- = Not Applicable; NA = Not Available; W = Withheld to avoid disclosure of individual company data. |
| Release Date: 6/30/2026 |
| Next Release Date: 7/31/2026 |