|
Download Data (XLS File) |
|
||||||||
|
||||||||
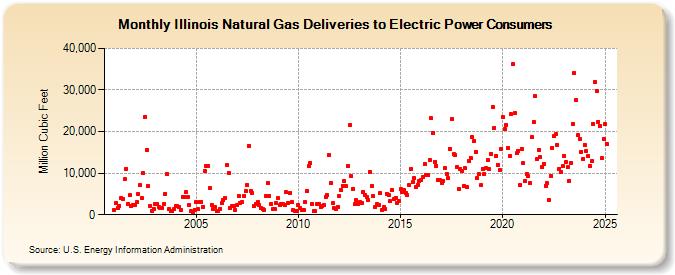
| Illinois Natural Gas Deliveries to Electric Power Consumers (Million Cubic Feet) | ||||||||
| Year | Jan | Feb | Mar | Apr | May | Jun | Jul | Aug | Sep | Oct | Nov | Dec |
|---|---|---|---|---|---|---|---|---|---|---|---|---|
| 2001 | 1,094 | 2,859 | 1,654 | 2,161 | 4,004 | 3,757 | 8,474 | 11,093 | 2,676 | 4,679 | 2,025 | 2,327 |
| 2002 | 2,251 | 3,005 | 4,995 | 7,075 | 3,969 | 9,924 | 23,588 | 15,556 | 6,897 | 2,177 | 1,013 | 1,418 |
| 2003 | 2,687 | 2,517 | 1,904 | 1,699 | 1,563 | 2,481 | 5,100 | 9,766 | 1,350 | 956 | 835 | 1,309 |
| 2004 | 2,156 | 2,007 | 1,760 | 1,124 | 4,328 | 4,378 | 5,391 | 4,356 | 2,351 | 794 | 764 | 1,215 |
| 2005 | 2,966 | 1,263 | 3,085 | 3,161 | 1,969 | 10,514 | 11,645 | 11,824 | 6,338 | 2,448 | 1,356 | 1,850 |
| 2006 | 887 | 962 | 1,482 | 2,869 | 3,469 | 4,022 | 12,012 | 10,068 | 1,637 | 2,160 | 2,028 | 1,133 |
| 2007 | 2,254 | 4,499 | 2,812 | 3,062 | 4,614 | 5,697 | 7,224 | 16,624 | 5,789 | 5,265 | 2,199 | 2,529 |
| 2008 | 3,089 | 2,368 | 1,711 | 1,394 | 1,163 | 4,444 | 7,670 | 4,509 | 2,658 | 1,404 | 1,374 | 2,802 |
| 2009 | 3,947 | 2,235 | 2,655 | 2,612 | 2,323 | 5,385 | 2,835 | 5,305 | 3,096 | 1,066 | 827 | 929 |
| 2010 | 2,363 | 1,560 | 1,180 | 1,163 | 3,042 | 5,663 | 11,666 | 12,470 | 2,598 | 818 | 792 | 2,584 |
| 2011 | 2,664 | 1,759 | 2,193 | 2,394 | 4,325 | 4,658 | 14,399 | 7,634 | 2,728 | 1,592 | 1,281 | 1,883 |
| 2012 | 4,389 | 5,844 | 6,931 | 8,032 | 6,809 | 11,741 | 21,542 | 9,250 | 6,252 | 2,496 | 3,507 | 2,507 |
| 2013 | 2,945 | 2,859 | 5,577 | 4,808 | 4,243 | 3,500 | 10,337 | 6,893 | 4,453 | 1,793 | 2,469 | 2,392 |
| 2014 | 5,120 | 1,231 | 1,901 | 1,418 | 5,096 | 4,657 | 3,248 | 5,892 | 3,675 | 4,129 | 2,842 | 3,329 |
| 2015 | 6,108 | 5,582 | 5,834 | 5,327 | 4,645 | 7,069 | 10,938 | 7,798 | 8,783 | 6,679 | 7,206 | 8,006 |
| 2016 | 8,337 | 8,962 | 12,168 | 9,543 | 9,544 | 13,199 | 23,160 | 19,713 | 12,773 | 11,723 | 8,346 | 8,248 |
| 2017 | 7,688 | 8,076 | 11,230 | 9,808 | 8,820 | 15,881 | 23,069 | 14,545 | 14,253 | 11,470 | 6,234 | 11,066 |
| 2018 | 10,632 | 7,007 | 11,164 | 6,558 | 12,898 | 13,746 | 18,653 | 17,615 | 15,149 | 8,865 | 9,717 | 7,044 |
| 2019 | 11,105 | 9,699 | 11,127 | 13,061 | 10,896 | 14,708 | 25,997 | 20,922 | 14,229 | 12,076 | 10,725 | 15,903 |
| 2020 | 23,484 | 20,658 | 21,580 | 15,928 | 14,155 | 24,158 | 36,152 | 24,428 | 14,772 | 15,389 | 7,131 | 15,851 |
| 2021 | 12,332 | 8,148 | 9,777 | 9,211 | 7,547 | 18,650 | 22,360 | 28,593 | 13,349 | 15,600 | 13,799 | 11,462 |
| 2022 | 12,314 | 7,021 | 7,558 | 3,600 | 9,288 | 16,117 | 18,847 | 19,338 | 16,809 | 11,076 | 10,163 | 11,676 |
| 2023 | 15,079 | 13,867 | 12,012 | 5,451 | 12,285 | 20,789 | 29,642 | 27,444 | 19,026 | 17,249 | 14,221 | 14,284 |
| 2024 | 16,670 | 15,713 | 13,314 | 8,699 | 11,930 | 19,210 | 25,999 | 27,807 | 23,110 | 18,002 | 11,460 | 17,057 |
| 2025 | 19,801 | 16,034 | 10,610 | 11,481 | 10,113 | 22,672 | 34,415 | 25,735 | 22,191 | 20,449 | 15,222 | 18,322 |
| 2026 | 21,557 | 16,346 | 13,109 | 14,207 | ||||||||
| - = No Data Reported; -- = Not Applicable; NA = Not Available; W = Withheld to avoid disclosure of individual company data. |
| Release Date: 6/30/2026 |
| Next Release Date: 7/31/2026 |