|
Download Data (XLS File) |
|
||||||||
|
||||||||
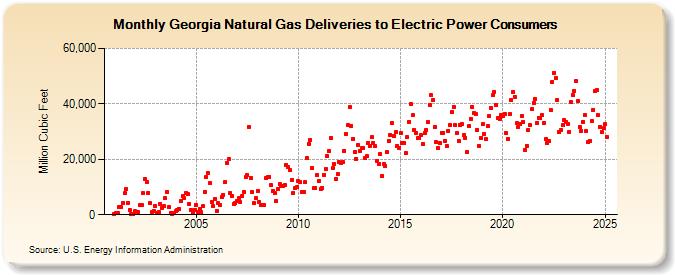
| Georgia Natural Gas Deliveries to Electric Power Consumers (Million Cubic Feet) | ||||||||
| Year | Jan | Feb | Mar | Apr | May | Jun | Jul | Aug | Sep | Oct | Nov | Dec |
|---|---|---|---|---|---|---|---|---|---|---|---|---|
| 2001 | 401 | 554 | 506 | 2,689 | 2,635 | 4,291 | 7,681 | 9,154 | 4,276 | 1,788 | 338 | 354 |
| 2002 | 1,191 | 887 | 863 | 3,430 | 3,377 | 7,736 | 12,902 | 11,906 | 7,887 | 4,206 | 849 | 1,354 |
| 2003 | 3,221 | 638 | 867 | 3,973 | 2,448 | 3,000 | 5,906 | 8,337 | 2,629 | 590 | 206 | 443 |
| 2004 | 1,274 | 1,704 | 2,152 | 4,875 | 6,650 | 6,005 | 7,918 | 7,322 | 3,993 | 1,716 | 573 | 1,743 |
| 2005 | 3,476 | 1,066 | 2,035 | 808 | 3,050 | 8,374 | 13,538 | 15,011 | 11,382 | 4,592 | 3,122 | 5,814 |
| 2006 | 1,368 | 4,057 | 3,476 | 6,395 | 7,215 | 11,768 | 18,747 | 19,963 | 7,802 | 6,850 | 3,690 | 4,075 |
| 2007 | 4,958 | 5,954 | 4,581 | 6,875 | 8,208 | 13,431 | 14,348 | 31,751 | 13,356 | 8,173 | 4,187 | 5,903 |
| 2008 | 8,644 | 4,587 | 3,348 | 3,552 | 3,568 | 13,278 | 13,494 | 13,761 | 10,605 | 8,566 | 7,918 | 4,995 |
| 2009 | 9,288 | 10,931 | 10,319 | 10,260 | 10,666 | 17,883 | 17,170 | 16,067 | 12,641 | 7,799 | 9,485 | 9,960 |
| 2010 | 12,077 | 11,638 | 8,032 | 8,284 | 11,679 | 20,307 | 25,582 | 27,114 | 16,787 | 9,472 | 9,732 | 14,376 |
| 2011 | 12,157 | 9,127 | 9,758 | 14,483 | 16,466 | 21,127 | 23,029 | 27,828 | 16,724 | 18,326 | 12,860 | 14,606 |
| 2012 | 18,869 | 18,706 | 19,050 | 23,144 | 29,164 | 32,369 | 38,917 | 32,124 | 27,422 | 22,727 | 20,277 | 25,326 |
| 2013 | 22,838 | 23,978 | 24,060 | 20,394 | 21,056 | 25,968 | 24,801 | 27,881 | 25,949 | 24,767 | 19,470 | 18,344 |
| 2014 | 21,864 | 14,144 | 18,337 | 17,644 | 22,444 | 26,583 | 28,806 | 32,954 | 28,534 | 29,677 | 24,819 | 24,167 |
| 2015 | 29,304 | 25,998 | 25,734 | 22,113 | 27,969 | 33,548 | 39,865 | 35,866 | 30,598 | 29,598 | 27,518 | 27,586 |
| 2016 | 28,632 | 25,673 | 29,414 | 30,539 | 33,281 | 39,622 | 43,072 | 41,343 | 31,766 | 26,055 | 23,983 | 25,902 |
| 2017 | 29,646 | 29,592 | 26,720 | 24,751 | 30,367 | 32,482 | 37,034 | 38,970 | 32,193 | 29,342 | 26,727 | 32,250 |
| 2018 | 32,719 | 28,617 | 27,811 | 22,534 | 32,021 | 34,627 | 38,986 | 36,694 | 36,328 | 30,715 | 24,793 | 27,801 |
| 2019 | 32,684 | 29,285 | 27,148 | 31,964 | 35,443 | 38,424 | 43,074 | 44,328 | 39,571 | 34,728 | 34,455 | 36,039 |
| 2020 | 35,734 | 36,444 | 29,393 | 27,440 | 36,320 | 41,421 | 44,260 | 42,639 | 33,025 | 31,621 | 32,761 | 35,619 |
| 2021 | 33,384 | 23,388 | 24,894 | 30,629 | 32,308 | 38,064 | 40,348 | 41,662 | 33,174 | 35,053 | 34,788 | 35,857 |
| 2022 | 33,225 | 27,188 | 25,796 | 26,499 | 37,761 | 48,024 | 51,251 | 49,381 | 41,296 | 29,729 | 30,598 | 32,330 |
| 2023 | 33,177 | 32,273 | 31,779 | 29,558 | 38,897 | 42,294 | 45,212 | 46,499 | 39,656 | 28,331 | 27,263 | 32,985 |
| 2024 | 35,105 | 29,280 | 24,086 | 25,507 | 32,273 | 37,330 | 45,965 | 45,683 | 36,601 | 31,906 | 29,252 | 31,525 |
| 2025 | 32,788 | 27,019 | 26,596 | 27,506 | 34,967 | 36,104 | 44,959 | 40,788 | 35,794 | 33,492 | 29,988 | 31,348 |
| 2026 | 32,921 | 29,473 | 30,954 | 29,087 | ||||||||
| - = No Data Reported; -- = Not Applicable; NA = Not Available; W = Withheld to avoid disclosure of individual company data. |
| Release Date: 6/30/2026 |
| Next Release Date: 7/31/2026 |