|
Download Data (XLS File) |
|
||||||||
|
||||||||
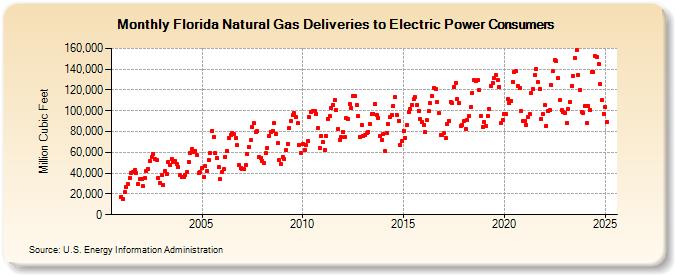
| Florida Natural Gas Deliveries to Electric Power Consumers (Million Cubic Feet) | ||||||||
| Year | Jan | Feb | Mar | Apr | May | Jun | Jul | Aug | Sep | Oct | Nov | Dec |
|---|---|---|---|---|---|---|---|---|---|---|---|---|
| 2001 | 17,288 | 15,149 | 21,938 | 26,673 | 29,161 | 35,294 | 40,418 | 41,538 | 42,864 | 40,435 | 29,384 | 34,168 |
| 2002 | 34,679 | 27,217 | 35,261 | 41,741 | 44,436 | 51,289 | 55,847 | 58,690 | 53,763 | 52,477 | 35,484 | 30,983 |
| 2003 | 37,980 | 28,693 | 42,017 | 39,455 | 50,901 | 47,753 | 53,548 | 51,138 | 51,573 | 48,650 | 45,632 | 37,759 |
| 2004 | 36,288 | 36,040 | 38,091 | 41,173 | 51,135 | 59,830 | 62,865 | 60,783 | 61,468 | 57,548 | 39,980 | 40,641 |
| 2005 | 44,733 | 36,459 | 46,794 | 42,028 | 52,577 | 59,238 | 80,627 | 74,855 | 58,916 | 54,543 | 45,508 | 34,132 |
| 2006 | 40,727 | 43,507 | 55,900 | 61,761 | 73,935 | 76,547 | 78,765 | 77,294 | 73,892 | 66,927 | 47,986 | 44,520 |
| 2007 | 44,311 | 43,715 | 47,535 | 57,966 | 65,441 | 71,448 | 84,294 | 87,749 | 79,545 | 80,206 | 55,758 | 55,002 |
| 2008 | 51,976 | 49,334 | 58,976 | 64,230 | 76,126 | 80,011 | 80,886 | 88,205 | 77,882 | 68,752 | 52,536 | 48,352 |
| 2009 | 55,650 | 53,123 | 61,875 | 68,225 | 83,334 | 90,163 | 95,459 | 97,461 | 93,798 | 87,912 | 67,151 | 59,522 |
| 2010 | 68,150 | 62,631 | 67,054 | 70,615 | 94,081 | 98,855 | 99,787 | 99,861 | 97,094 | 83,333 | 64,521 | 75,769 |
| 2011 | 69,954 | 62,308 | 75,884 | 92,345 | 94,558 | 102,529 | 105,913 | 110,489 | 100,705 | 82,404 | 72,272 | 74,424 |
| 2012 | 79,830 | 74,712 | 92,620 | 92,374 | 106,171 | 102,818 | 114,669 | 114,407 | 105,942 | 94,486 | 74,621 | 86,123 |
| 2013 | 75,863 | 76,355 | 78,330 | 79,959 | 86,799 | 97,022 | 97,085 | 106,623 | 95,487 | 93,173 | 76,000 | 71,591 |
| 2014 | 77,962 | 60,860 | 78,226 | 87,132 | 94,357 | 95,806 | 104,729 | 112,988 | 96,134 | 90,571 | 67,333 | 70,656 |
| 2015 | 80,767 | 73,961 | 86,030 | 98,530 | 101,383 | 105,715 | 110,857 | 112,839 | 105,618 | 100,010 | 91,640 | 89,257 |
| 2016 | 86,725 | 79,445 | 90,865 | 99,955 | 107,010 | 114,348 | 122,367 | 120,692 | 108,909 | 97,396 | 76,993 | 76,746 |
| 2017 | 78,350 | 73,795 | 87,323 | 90,596 | 108,854 | 107,190 | 122,741 | 127,055 | 111,400 | 107,333 | 85,618 | 86,656 |
| 2018 | 90,270 | 82,625 | 91,207 | 94,955 | 103,489 | 117,564 | 129,387 | 129,082 | 129,251 | 119,902 | 94,725 | 84,364 |
| 2019 | 89,296 | 85,458 | 94,963 | 101,833 | 124,181 | 126,998 | 131,563 | 134,517 | 130,050 | 123,221 | 87,836 | 91,154 |
| 2020 | 96,800 | 96,651 | 110,875 | 107,515 | 109,405 | 127,732 | 137,344 | 138,090 | 123,513 | 121,615 | 99,331 | 90,279 |
| 2021 | 90,599 | 86,366 | 94,000 | 97,046 | 116,654 | 120,858 | 134,201 | 139,901 | 127,392 | 121,001 | 92,050 | 96,851 |
| 2022 | 105,162 | 85,428 | 99,550 | 100,279 | 124,586 | 137,817 | 148,581 | 147,594 | 131,047 | 109,895 | 100,403 | 98,811 |
| 2023 | 97,032 | 87,112 | 103,974 | 110,025 | 123,318 | 131,891 | 148,655 | 155,781 | 132,835 | 119,144 | 98,301 | 97,054 |
| 2024 | 103,192 | 89,256 | 105,653 | 101,364 | 138,199 | 137,666 | 152,427 | 151,171 | 144,653 | 124,040 | 109,892 | 96,935 |
| 2025 | 104,137 | 89,330 | 95,181 | 101,472 | 129,196 | 136,423 | 150,980 | 149,471 | 131,493 | 120,369 | 92,331 | 96,349 |
| 2026 | 99,445 | 92,626 | 102,400 | 104,663 | ||||||||
| - = No Data Reported; -- = Not Applicable; NA = Not Available; W = Withheld to avoid disclosure of individual company data. |
| Release Date: 6/30/2026 |
| Next Release Date: 7/31/2026 |