|
Download Data (XLS File) |
|
||||||||
|
||||||||
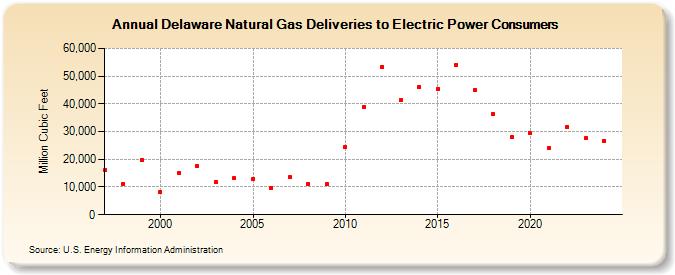
| Delaware Natural Gas Deliveries to Electric Power Consumers (Million Cubic Feet) | ||||||||
| Decade | Year-0 | Year-1 | Year-2 | Year-3 | Year-4 | Year-5 | Year-6 | Year-7 | Year-8 | Year-9 |
|---|---|---|---|---|---|---|---|---|---|---|
| 1990's | 16,092 | 11,135 | 19,879 | |||||||
| 2000's | 8,371 | 15,129 | 17,460 | 11,712 | 13,067 | 12,875 | 9,522 | 13,493 | 11,181 | 10,990 |
| 2010's | 24,383 | 38,984 | 53,295 | 41,487 | 46,136 | 45,450 | 54,156 | 44,961 | 36,328 | 28,101 |
| 2020's | 29,361 | 24,020 | 31,728 | 27,181 | 27,465 | 29,568 |
| - = No Data Reported; -- = Not Applicable; NA = Not Available; W = Withheld to avoid disclosure of individual company data. |
| Release Date: 6/30/2026 |
| Next Release Date: 7/31/2026 |