|
Download Data (XLS File) |
|
||||||||
|
||||||||
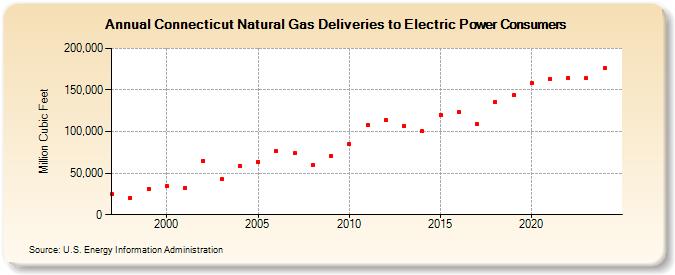
| Connecticut Natural Gas Deliveries to Electric Power Consumers (Million Cubic Feet) | ||||||||
| Decade | Year-0 | Year-1 | Year-2 | Year-3 | Year-4 | Year-5 | Year-6 | Year-7 | Year-8 | Year-9 |
|---|---|---|---|---|---|---|---|---|---|---|
| 1990's | 24,398 | 20,417 | 31,229 | |||||||
| 2000's | 34,401 | 32,161 | 65,060 | 42,569 | 58,834 | 63,896 | 76,024 | 73,627 | 59,354 | 70,864 |
| 2010's | 85,144 | 107,897 | 114,054 | 106,863 | 100,359 | 119,907 | 123,024 | 108,687 | 136,075 | 143,448 |
| 2020's | 157,861 | 163,495 | 164,634 | 167,655 | 174,768 | 164,496 |
| - = No Data Reported; -- = Not Applicable; NA = Not Available; W = Withheld to avoid disclosure of individual company data. |
| Release Date: 6/30/2026 |
| Next Release Date: 7/31/2026 |