|
Download Data (XLS File) |
|
||||||||
|
||||||||
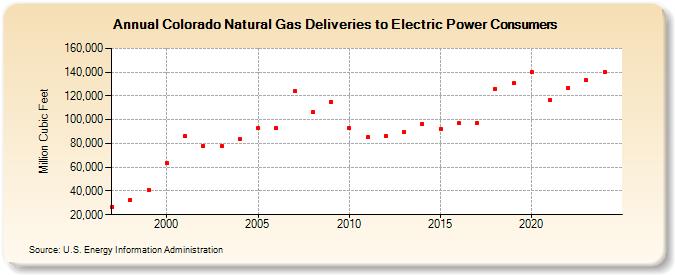
| Colorado Natural Gas Deliveries to Electric Power Consumers (Million Cubic Feet) | ||||||||
| Decade | Year-0 | Year-1 | Year-2 | Year-3 | Year-4 | Year-5 | Year-6 | Year-7 | Year-8 | Year-9 |
|---|---|---|---|---|---|---|---|---|---|---|
| 1990's | 26,802 | 32,640 | 40,879 | |||||||
| 2000's | 63,253 | 85,954 | 78,171 | 77,895 | 83,369 | 92,629 | 92,927 | 123,788 | 106,454 | 115,234 |
| 2010's | 92,657 | 85,015 | 86,309 | 89,508 | 96,589 | 92,304 | 96,923 | 97,536 | 125,894 | 130,775 |
| 2020's | 140,222 | 116,288 | 126,746 | 133,615 | 141,984 | 141,757 |
| - = No Data Reported; -- = Not Applicable; NA = Not Available; W = Withheld to avoid disclosure of individual company data. |
| Release Date: 6/30/2026 |
| Next Release Date: 7/31/2026 |