|
Download Data (XLS File) |
|
||||||||
|
||||||||
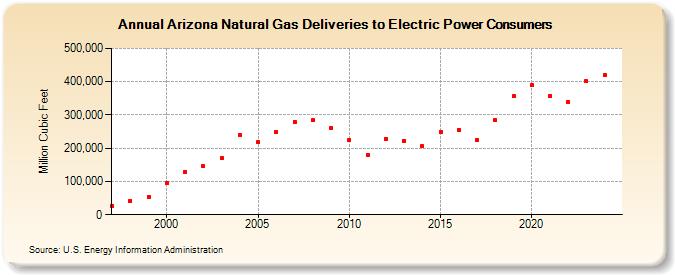
| Arizona Natural Gas Deliveries to Electric Power Consumers (Million Cubic Feet) | ||||||||
| Decade | Year-0 | Year-1 | Year-2 | Year-3 | Year-4 | Year-5 | Year-6 | Year-7 | Year-8 | Year-9 |
|---|---|---|---|---|---|---|---|---|---|---|
| 1990's | 26,692 | 42,267 | 54,685 | |||||||
| 2000's | 95,881 | 129,086 | 145,346 | 170,140 | 240,321 | 217,485 | 248,146 | 280,156 | 283,817 | 261,904 |
| 2010's | 224,430 | 180,966 | 228,818 | 222,985 | 205,697 | 248,369 | 255,498 | 223,952 | 284,651 | 356,307 |
| 2020's | 388,859 | 357,748 | 338,614 | 401,567 | 419,141 | 398,466 |
| - = No Data Reported; -- = Not Applicable; NA = Not Available; W = Withheld to avoid disclosure of individual company data. |
| Release Date: 6/30/2026 |
| Next Release Date: 7/31/2026 |