|
Download Data (XLS File) |
|
||||||||
|
||||||||
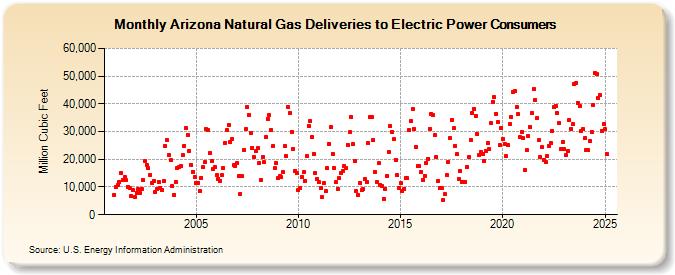
| Arizona Natural Gas Deliveries to Electric Power Consumers (Million Cubic Feet) | ||||||||
| Year | Jan | Feb | Mar | Apr | May | Jun | Jul | Aug | Sep | Oct | Nov | Dec |
|---|---|---|---|---|---|---|---|---|---|---|---|---|
| 2001 | 7,206 | 10,178 | 10,723 | 11,729 | 14,944 | 12,611 | 13,636 | 12,373 | 10,115 | 9,808 | 6,853 | 8,910 |
| 2002 | 6,386 | 7,902 | 9,125 | 7,964 | 9,245 | 12,579 | 19,305 | 17,996 | 16,847 | 14,354 | 11,510 | 12,131 |
| 2003 | 8,033 | 9,177 | 11,951 | 9,660 | 8,750 | 12,182 | 24,698 | 26,821 | 21,367 | 19,806 | 10,442 | 7,253 |
| 2004 | 11,922 | 16,931 | 17,044 | 17,528 | 21,411 | 24,959 | 31,355 | 28,859 | 23,051 | 18,066 | 15,540 | 13,656 |
| 2005 | 11,557 | 11,589 | 8,394 | 13,303 | 17,038 | 18,875 | 30,885 | 30,523 | 22,218 | 19,430 | 16,475 | 17,199 |
| 2006 | 14,183 | 12,939 | 12,286 | 14,248 | 16,913 | 25,899 | 30,470 | 32,300 | 26,270 | 27,279 | 17,806 | 17,554 |
| 2007 | 18,565 | 13,873 | 7,509 | 13,843 | 23,430 | 30,813 | 38,830 | 36,053 | 29,492 | 24,194 | 20,661 | 22,894 |
| 2008 | 23,966 | 18,591 | 12,451 | 20,821 | 18,871 | 27,978 | 34,637 | 35,815 | 30,603 | 24,779 | 16,681 | 18,623 |
| 2009 | 13,115 | 13,961 | 13,533 | 15,353 | 24,652 | 21,104 | 38,981 | 36,613 | 29,935 | 23,706 | 15,914 | 15,039 |
| 2010 | 9,053 | 9,482 | 13,644 | 15,326 | 12,327 | 21,045 | 31,990 | 33,649 | 27,946 | 22,024 | 15,010 | 12,934 |
| 2011 | 11,666 | 9,602 | 6,239 | 11,340 | 8,379 | 16,715 | 25,648 | 31,547 | 21,994 | 16,841 | 11,627 | 9,369 |
| 2012 | 13,126 | 15,085 | 15,876 | 17,556 | 16,742 | 25,082 | 29,722 | 35,177 | 25,391 | 19,457 | 8,550 | 7,054 |
| 2013 | 11,476 | 8,874 | 9,255 | 12,787 | 11,628 | 25,794 | 35,134 | 35,254 | 26,902 | 15,399 | 11,974 | 18,509 |
| 2014 | 10,767 | 10,276 | 5,744 | 9,439 | 14,062 | 22,799 | 31,950 | 29,903 | 27,212 | 19,861 | 14,175 | 9,510 |
| 2015 | 11,324 | 8,648 | 9,360 | 13,276 | 13,127 | 30,516 | 33,640 | 38,045 | 30,919 | 24,377 | 17,648 | 17,489 |
| 2016 | 15,254 | 12,559 | 14,142 | 18,638 | 20,255 | 31,042 | 36,488 | 36,031 | 28,584 | 20,783 | 12,132 | 9,591 |
| 2017 | 9,535 | 5,362 | 7,331 | 14,262 | 19,064 | 27,646 | 34,287 | 31,172 | 24,844 | 21,725 | 12,898 | 15,827 |
| 2018 | 11,913 | 11,957 | 11,912 | 17,335 | 20,670 | 27,027 | 36,701 | 38,223 | 35,544 | 29,070 | 21,538 | 22,760 |
| 2019 | 21,865 | 19,476 | 23,035 | 25,868 | 23,595 | 33,077 | 40,819 | 42,354 | 36,466 | 33,416 | 25,141 | 31,195 |
| 2020 | 27,320 | 25,511 | 21,062 | 25,226 | 32,625 | 35,315 | 44,402 | 44,619 | 38,874 | 36,227 | 27,920 | 29,758 |
| 2021 | 27,579 | 16,292 | 23,200 | 28,302 | 31,809 | 36,739 | 45,370 | 41,459 | 34,858 | 26,786 | 20,940 | 24,413 |
| 2022 | 19,753 | 18,896 | 21,071 | 24,951 | 25,823 | 30,327 | 38,782 | 39,359 | 36,617 | 33,174 | 23,612 | 26,248 |
| 2023 | 23,757 | 21,543 | 23,169 | 34,182 | 31,035 | 32,756 | 47,102 | 47,430 | 40,455 | 39,085 | 30,288 | 30,765 |
| 2024 | 27,482 | 23,210 | 23,190 | 26,404 | 29,782 | 39,683 | 50,869 | 50,593 | 41,864 | 43,060 | 30,411 | 32,594 |
| 2025 | 30,778 | 21,766 | 17,506 | 25,328 | 30,143 | 35,503 | 45,981 | 51,817 | 44,220 | 37,196 | 30,391 | 27,838 |
| 2026 | 27,279 | 21,589 | 25,082 | |||||||||
| - = No Data Reported; -- = Not Applicable; NA = Not Available; W = Withheld to avoid disclosure of individual company data. |
| Release Date: 5/29/2026 |
| Next Release Date: 6/30/2026 |