|
Download Data (XLS File) |
|
||||||||
|
||||||||
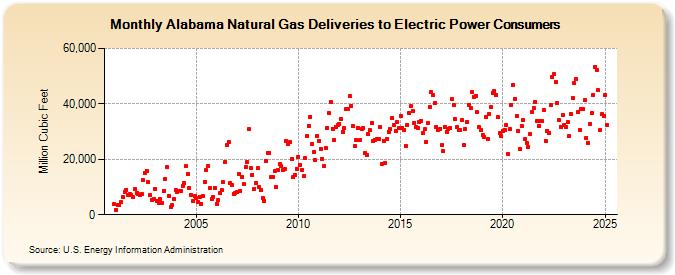
| Alabama Natural Gas Deliveries to Electric Power Consumers (Million Cubic Feet) | ||||||||
| Year | Jan | Feb | Mar | Apr | May | Jun | Jul | Aug | Sep | Oct | Nov | Dec |
|---|---|---|---|---|---|---|---|---|---|---|---|---|
| 2001 | 3,691 | 1,856 | 3,634 | 3,342 | 4,651 | 6,493 | 8,348 | 8,892 | 7,157 | 7,473 | 7,007 | 6,324 |
| 2002 | 9,105 | 8,006 | 7,301 | 7,217 | 7,316 | 12,396 | 15,228 | 15,892 | 11,855 | 7,064 | 5,415 | 5,608 |
| 2003 | 9,428 | 5,069 | 4,057 | 5,528 | 4,274 | 8,673 | 12,971 | 17,126 | 6,906 | 2,735 | 3,573 | 5,791 |
| 2004 | 9,038 | 8,270 | 8,672 | 8,552 | 10,409 | 11,388 | 17,481 | 14,662 | 9,689 | 7,254 | 4,995 | 6,647 |
| 2005 | 6,019 | 4,524 | 6,532 | 3,991 | 6,678 | 11,921 | 15,974 | 17,573 | 9,582 | 5,720 | 6,523 | 9,749 |
| 2006 | 4,041 | 5,197 | 7,726 | 9,059 | 11,642 | 19,064 | 25,244 | 26,196 | 11,340 | 10,610 | 7,580 | 7,829 |
| 2007 | 8,257 | 14,805 | 8,691 | 13,770 | 10,908 | 17,205 | 19,033 | 30,741 | 16,900 | 14,378 | 9,449 | 11,598 |
| 2008 | 16,783 | 10,014 | 8,904 | 6,098 | 5,052 | 19,298 | 22,432 | 22,280 | 13,647 | 13,777 | 15,854 | 10,127 |
| 2009 | 16,029 | 18,184 | 17,513 | 16,260 | 16,319 | 26,458 | 25,545 | 26,091 | 20,072 | 13,515 | 14,408 | 16,619 |
| 2010 | 20,779 | 18,112 | 16,230 | 13,842 | 20,433 | 28,533 | 32,168 | 35,283 | 25,629 | 22,719 | 19,702 | 28,293 |
| 2011 | 26,720 | 23,752 | 20,204 | 17,484 | 23,979 | 31,413 | 36,666 | 40,688 | 31,065 | 26,923 | 31,662 | 32,287 |
| 2012 | 32,868 | 34,517 | 29,927 | 31,146 | 37,974 | 38,229 | 42,746 | 39,324 | 31,873 | 24,622 | 26,858 | 31,222 |
| 2013 | 26,971 | 30,863 | 31,388 | 22,245 | 21,578 | 29,020 | 30,428 | 33,105 | 26,571 | 27,082 | 27,211 | 27,437 |
| 2014 | 31,639 | 18,406 | 26,747 | 18,805 | 27,325 | 30,018 | 30,843 | 34,915 | 32,493 | 30,282 | 33,380 | 31,210 |
| 2015 | 35,709 | 31,360 | 30,383 | 24,902 | 32,391 | 36,718 | 39,113 | 37,362 | 33,206 | 31,618 | 31,415 | 33,320 |
| 2016 | 33,919 | 29,302 | 30,787 | 26,247 | 33,044 | 39,006 | 44,142 | 43,070 | 40,185 | 31,645 | 30,551 | 31,015 |
| 2017 | 25,217 | 22,805 | 31,584 | 29,957 | 30,940 | 31,237 | 41,700 | 39,609 | 34,365 | 31,595 | 30,617 | 30,413 |
| 2018 | 34,239 | 25,181 | 31,064 | 33,626 | 39,503 | 38,610 | 44,173 | 42,422 | 42,871 | 36,929 | 31,598 | 30,691 |
| 2019 | 28,621 | 28,043 | 35,315 | 27,244 | 36,268 | 38,809 | 43,960 | 44,599 | 43,266 | 35,092 | 29,432 | 28,282 |
| 2020 | 30,368 | 30,671 | 32,206 | 21,932 | 30,958 | 39,630 | 46,973 | 41,842 | 35,648 | 30,365 | 23,650 | 31,923 |
| 2021 | 33,995 | 27,255 | 25,905 | 24,456 | 28,957 | 37,057 | 38,385 | 40,819 | 33,860 | 31,870 | 33,914 | 33,767 |
| 2022 | 37,718 | 26,678 | 30,242 | 29,403 | 39,647 | 49,556 | 50,838 | 47,792 | 40,347 | 34,017 | 31,771 | 35,987 |
| 2023 | 32,118 | 31,900 | 34,085 | 28,943 | 35,870 | 42,149 | 47,138 | 47,355 | 36,926 | 30,818 | 38,805 | 41,270 |
| 2024 | 41,891 | 28,072 | 25,917 | 32,754 | 35,625 | 42,728 | 52,603 | 51,992 | 44,185 | 31,080 | 35,848 | 36,411 |
| 2025 | 42,621 | 31,891 | 34,142 | 32,731 | 37,299 | 43,868 | 50,863 | 41,452 | 38,974 | 33,528 | 34,149 | 40,547 |
| 2026 | 39,696 | 29,820 | 28,710 | 35,459 | ||||||||
| - = No Data Reported; -- = Not Applicable; NA = Not Available; W = Withheld to avoid disclosure of individual company data. |
| Release Date: 6/30/2026 |
| Next Release Date: 7/31/2026 |