|
Download Data (XLS File) |
|
||||||||
|
||||||||
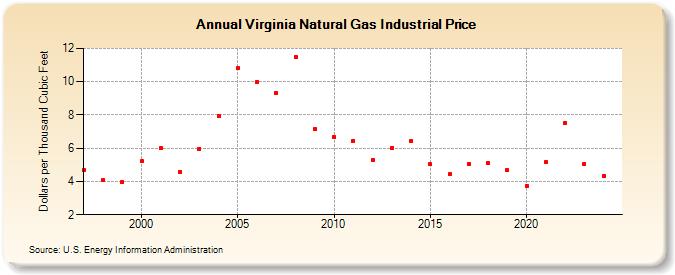
| Virginia Natural Gas Industrial Price (Dollars per Thousand Cubic Feet) | ||||||||
| Decade | Year-0 | Year-1 | Year-2 | Year-3 | Year-4 | Year-5 | Year-6 | Year-7 | Year-8 | Year-9 |
|---|---|---|---|---|---|---|---|---|---|---|
| 1990's | 4.68 | 4.07 | 3.94 | |||||||
| 2000's | 5.20 | 5.99 | 4.59 | 5.97 | 7.91 | 10.83 | 9.98 | 9.33 | 11.49 | 7.14 |
| 2010's | 6.68 | 6.44 | 5.29 | 6.02 | 6.43 | 5.02 | 4.42 | 5.04 | 5.08 | 4.66 |
| 2020's | 3.75 | 5.16 | 7.53 | 5.05 | 4.35 | NA |
| - = No Data Reported; -- = Not Applicable; NA = Not Available; W = Withheld to avoid disclosure of individual company data. |
| Release Date: 7/31/2026 |
| Next Release Date: 8/31/2026 |