|
Download Data (XLS File) |
|
||||||||
|
||||||||
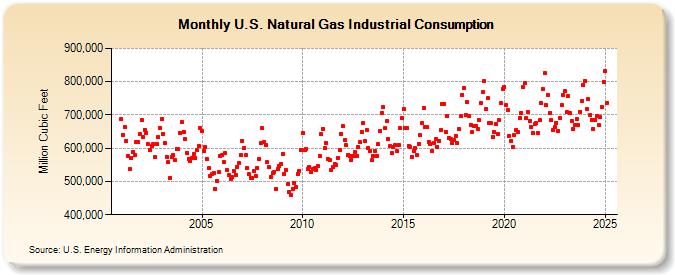
| U.S. Natural Gas Industrial Consumption (Million Cubic Feet) | ||||||||
| Year | Jan | Feb | Mar | Apr | May | Jun | Jul | Aug | Sep | Oct | Nov | Dec |
|---|---|---|---|---|---|---|---|---|---|---|---|---|
| 2001 | 686,540 | 640,026 | 664,918 | 622,054 | 576,532 | 536,820 | 570,067 | 589,875 | 578,590 | 617,291 | 618,950 | 642,556 |
| 2002 | 686,108 | 632,621 | 655,854 | 646,534 | 611,973 | 595,674 | 605,786 | 611,822 | 573,310 | 613,448 | 632,273 | 661,782 |
| 2003 | 687,821 | 643,666 | 615,956 | 574,624 | 557,167 | 511,339 | 574,374 | 580,776 | 564,407 | 598,581 | 596,599 | 645,086 |
| 2004 | 680,076 | 648,777 | 627,150 | 585,952 | 568,079 | 562,774 | 570,650 | 583,113 | 569,609 | 593,409 | 606,591 | 660,229 |
| 2005 | 650,989 | 590,965 | 604,866 | 566,130 | 540,722 | 516,522 | 521,733 | 526,148 | 477,413 | 501,875 | 527,303 | 576,502 |
| 2006 | 579,855 | 559,052 | 584,380 | 534,140 | 520,100 | 508,098 | 512,194 | 530,783 | 520,351 | 544,311 | 554,208 | 579,073 |
| 2007 | 621,914 | 599,687 | 578,474 | 539,684 | 521,172 | 510,823 | 510,518 | 531,132 | 517,561 | 540,961 | 568,218 | 614,573 |
| 2008 | 659,829 | 617,738 | 609,930 | 557,357 | 542,602 | 513,401 | 525,607 | 528,741 | 477,778 | 537,665 | 546,277 | 553,255 |
| 2009 | 582,995 | 523,688 | 535,671 | 492,412 | 467,679 | 459,110 | 476,270 | 495,412 | 483,796 | 521,880 | 532,696 | 595,763 |
| 2010 | 644,259 | 595,295 | 598,498 | 537,745 | 544,323 | 529,191 | 537,138 | 539,366 | 535,739 | 546,520 | 576,758 | 641,361 |
| 2011 | 658,927 | 599,754 | 615,767 | 568,804 | 563,102 | 535,440 | 542,556 | 553,670 | 549,196 | 570,646 | 594,199 | 642,060 |
| 2012 | 665,876 | 623,215 | 608,538 | 579,515 | 576,282 | 565,812 | 575,079 | 587,219 | 575,034 | 602,786 | 617,247 | 649,613 |
| 2013 | 676,303 | 622,193 | 654,009 | 600,591 | 592,942 | 563,890 | 577,915 | 591,603 | 575,038 | 611,884 | 652,358 | 706,724 |
| 2014 | 722,327 | 659,190 | 680,634 | 627,785 | 606,067 | 585,811 | 605,051 | 608,533 | 590,989 | 609,917 | 659,624 | 690,112 |
| 2015 | 718,319 | 659,623 | 661,612 | 607,933 | 602,843 | 574,682 | 591,900 | 599,867 | 579,061 | 612,994 | 638,537 | 674,532 |
| 2016 | 721,171 | 662,790 | 662,694 | 620,045 | 612,675 | 590,392 | 616,480 | 627,541 | 603,868 | 622,720 | 654,119 | 734,194 |
| 2017 | 734,212 | 649,811 | 696,319 | 631,624 | 628,407 | 614,294 | 623,497 | 636,935 | 615,144 | 656,558 | 695,526 | 760,689 |
| 2018 | 782,206 | 699,106 | 737,863 | 697,338 | 670,722 | 649,104 | 667,748 | 667,914 | 657,035 | 684,417 | 735,954 | 767,892 |
| 2019 | 800,585 | 718,873 | 750,058 | 675,101 | 674,882 | 634,196 | 649,556 | 672,373 | 643,905 | 683,580 | 734,619 | 778,934 |
| 2020 | 784,771 | 728,841 | 714,961 | 637,697 | 621,171 | 604,852 | 638,146 | 653,337 | 648,258 | 690,990 | 706,540 | 783,412 |
| 2021 | 795,902 | 689,665 | 709,037 | 681,568 | 664,329 | 644,434 | 672,547 | 674,451 | 645,093 | 683,616 | 736,119 | 777,910 |
| 2022 | 824,731 | 728,789 | 760,349 | 705,116 | 683,269 | 654,152 | 663,902 | 676,138 | 652,546 | 691,105 | 728,924 | 760,054 |
| 2023 | 770,834 | 708,623 | 757,590 | 707,035 | 682,101 | 656,197 | 669,838 | 687,616 | 670,632 | 710,376 | 741,716 | 790,168 |
| 2024 | 801,204 | 717,862 | 747,500 | 699,434 | 685,074 | 657,738 | 686,300 | 698,457 | 669,907 | 693,471 | 725,171 | 797,643 |
| 2025 | 828,017 | 732,153 | 745,013 | 696,534 | 691,288 | 654,923 | 680,733 | 693,841 | 670,689 | 692,539 | 739,537 | 799,985 |
| 2026 | 808,331 | 713,324 | 741,298 | 699,497 | ||||||||
| - = No Data Reported; -- = Not Applicable; NA = Not Available; W = Withheld to avoid disclosure of individual company data. |
| Release Date: 6/30/2026 |
| Next Release Date: 7/31/2026 |