|
Download Data (XLS File) |
|
||||||||
|
||||||||
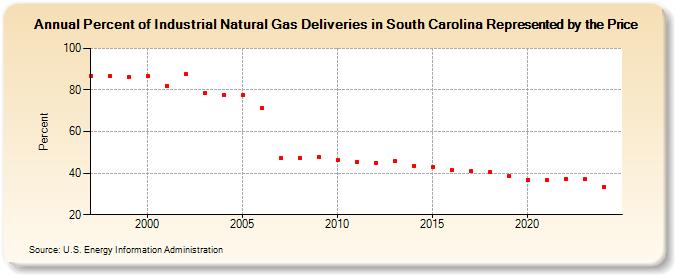
| Percent of Industrial Natural Gas Deliveries in South Carolina Represented by the Price (Percent) | ||||||||
| Decade | Year-0 | Year-1 | Year-2 | Year-3 | Year-4 | Year-5 | Year-6 | Year-7 | Year-8 | Year-9 |
|---|---|---|---|---|---|---|---|---|---|---|
| 1990's | 86.9 | 86.7 | 86.1 | |||||||
| 2000's | 86.5 | 82.1 | 87.7 | 78.5 | 77.8 | 77.4 | 71.4 | 47.3 | 47.3 | 47.6 |
| 2010's | 46.3 | 45.4 | 45.1 | 45.6 | 43.6 | 42.9 | 41.3 | 40.8 | 40.4 | 38.5 |
| 2020's | 36.9 | 36.7 | 37.2 | 37.0 | 33.5 | NA |
| - = No Data Reported; -- = Not Applicable; NA = Not Available; W = Withheld to avoid disclosure of individual company data. |
| Release Date: 5/29/2026 |
| Next Release Date: 6/30/2026 |