|
Download Data (XLS File) |
|
||||||||
|
||||||||
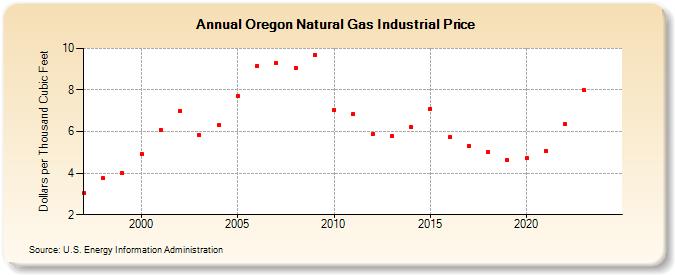
| Oregon Natural Gas Industrial Price (Dollars per Thousand Cubic Feet) | ||||||||
| Decade | Year-0 | Year-1 | Year-2 | Year-3 | Year-4 | Year-5 | Year-6 | Year-7 | Year-8 | Year-9 |
|---|---|---|---|---|---|---|---|---|---|---|
| 1990's | 3.03 | 3.75 | 4.01 | |||||||
| 2000's | 4.93 | 6.09 | 6.98 | 5.84 | 6.30 | 7.70 | 9.16 | 9.30 | 9.07 | 9.70 |
| 2010's | 7.05 | 6.84 | 5.87 | 5.79 | 6.20 | 7.10 | 5.73 | 5.31 | 5.01 | 4.62 |
| 2020's | 4.73 | 5.07 | 6.34 | 7.98 | 6.91 | 6.55 |
| - = No Data Reported; -- = Not Applicable; NA = Not Available; W = Withheld to avoid disclosure of individual company data. |
| Release Date: 6/30/2026 |
| Next Release Date: 7/31/2026 |