|
Download Data (XLS File) |
|
||||||||
|
||||||||
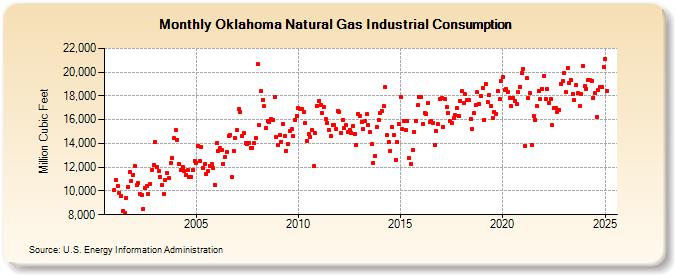
| Oklahoma Natural Gas Industrial Consumption (Million Cubic Feet) | ||||||||
| Year | Jan | Feb | Mar | Apr | May | Jun | Jul | Aug | Sep | Oct | Nov | Dec |
|---|---|---|---|---|---|---|---|---|---|---|---|---|
| 2001 | 10,099 | 10,890 | 10,450 | 9,852 | 9,605 | 8,292 | 8,183 | 9,437 | 10,333 | 11,560 | 10,829 | 11,371 |
| 2002 | 12,141 | 10,474 | 10,650 | 9,757 | 9,627 | 8,483 | 10,232 | 10,436 | 9,783 | 10,612 | 11,799 | 12,211 |
| 2003 | 14,135 | 11,988 | 11,704 | 11,216 | 10,525 | 9,751 | 10,952 | 11,488 | 11,057 | 12,316 | 12,760 | 14,423 |
| 2004 | 15,167 | 14,324 | 12,285 | 11,799 | 11,991 | 11,641 | 11,355 | 11,723 | 11,157 | 11,189 | 11,798 | 12,549 |
| 2005 | 12,333 | 13,811 | 12,546 | 13,724 | 11,949 | 12,281 | 11,409 | 11,658 | 12,140 | 12,265 | 11,940 | 10,536 |
| 2006 | 14,008 | 13,352 | 13,574 | 13,489 | 12,310 | 12,862 | 13,302 | 14,628 | 14,747 | 11,136 | 13,371 | 14,452 |
| 2007 | 15,091 | 16,919 | 16,642 | 14,626 | 14,857 | 14,010 | 13,933 | 14,017 | 13,656 | 13,655 | 14,013 | 14,463 |
| 2008 | 20,716 | 15,518 | 18,409 | 17,660 | 17,114 | 15,316 | 15,856 | 15,784 | 16,056 | 16,008 | 17,882 | 14,509 |
| 2009 | 13,876 | 14,673 | 14,146 | 15,669 | 14,628 | 13,374 | 13,955 | 15,073 | 15,181 | 14,620 | 15,973 | 16,351 |
| 2010 | 16,998 | 16,869 | 16,916 | 16,640 | 15,694 | 14,242 | 14,784 | 14,544 | 15,115 | 12,090 | 14,852 | 17,165 |
| 2011 | 17,612 | 17,238 | 16,553 | 17,039 | 16,033 | 15,757 | 15,140 | 14,616 | 15,539 | 15,582 | 15,183 | 16,709 |
| 2012 | 16,647 | 14,909 | 15,975 | 15,276 | 15,518 | 14,971 | 15,161 | 14,868 | 15,490 | 14,827 | 13,869 | 16,494 |
| 2013 | 16,323 | 15,833 | 15,213 | 15,890 | 16,474 | 15,531 | 14,952 | 13,917 | 12,393 | 12,932 | 15,372 | 15,979 |
| 2014 | 16,585 | 16,753 | 17,110 | 18,764 | 14,683 | 14,108 | 13,397 | 15,350 | 14,694 | 12,644 | 14,127 | 15,658 |
| 2015 | 17,893 | 15,206 | 15,918 | 15,171 | 15,911 | 12,772 | 12,251 | 13,427 | 14,973 | 15,893 | 17,201 | 17,932 |
| 2016 | 17,935 | 15,612 | 16,558 | 16,462 | 17,437 | 15,793 | 15,913 | 15,755 | 13,868 | 15,060 | 15,596 | 17,713 |
| 2017 | 17,803 | 15,393 | 17,748 | 17,062 | 16,581 | 15,879 | 15,682 | 16,118 | 16,353 | 17,005 | 16,342 | 17,610 |
| 2018 | 18,387 | 17,413 | 18,122 | 17,675 | 17,615 | 16,019 | 15,238 | 16,558 | 17,229 | 18,294 | 17,316 | 18,034 |
| 2019 | 18,707 | 16,001 | 19,006 | 17,484 | 18,048 | 17,183 | 16,177 | 16,650 | 16,514 | 18,413 | 17,725 | 19,260 |
| 2020 | 19,587 | 18,506 | 18,561 | 18,362 | 17,852 | 17,110 | 17,839 | 17,562 | 17,350 | 18,293 | 18,771 | 19,915 |
| 2021 | 20,275 | 13,743 | 19,506 | 17,795 | 18,214 | 13,868 | 16,309 | 16,002 | 17,123 | 18,373 | 17,698 | 18,605 |
| 2022 | 19,650 | 17,764 | 18,568 | 17,445 | 17,703 | 15,519 | 16,990 | 16,992 | 16,668 | 16,850 | 19,022 | 19,244 |
| 2023 | 19,911 | 18,325 | 20,374 | 19,106 | 19,323 | 18,178 | 17,653 | 18,915 | 18,205 | 17,129 | 18,186 | 20,527 |
| 2024 | 18,831 | 18,637 | 19,330 | 19,325 | 19,240 | 17,878 | 18,238 | 16,273 | 18,548 | 18,757 | 18,733 | 20,479 |
| 2025 | 21,118 | 18,415 | 19,908 | 18,757 | 18,225 | 13,789 | 16,592 | 17,216 | 17,794 | 18,986 | 18,509 | 20,615 |
| 2026 | 20,225 | 18,281 | 20,014 | 19,506 | ||||||||
| - = No Data Reported; -- = Not Applicable; NA = Not Available; W = Withheld to avoid disclosure of individual company data. |
| Release Date: 6/30/2026 |
| Next Release Date: 7/31/2026 |