|
Download Data (XLS File) |
|
||||||||
|
||||||||
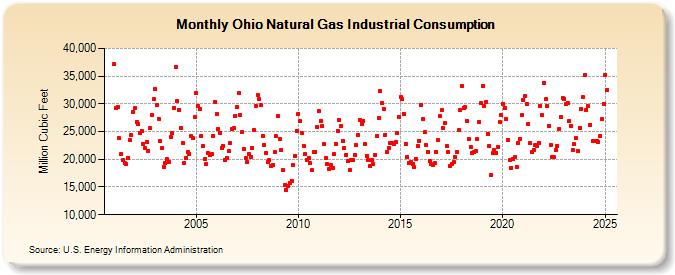
| Ohio Natural Gas Industrial Consumption (Million Cubic Feet) | ||||||||
| Year | Jan | Feb | Mar | Apr | May | Jun | Jul | Aug | Sep | Oct | Nov | Dec |
|---|---|---|---|---|---|---|---|---|---|---|---|---|
| 2001 | 37,109 | 29,330 | 29,486 | 23,751 | 20,933 | 19,944 | 19,239 | 19,128 | 20,275 | 23,504 | 24,307 | 28,550 |
| 2002 | 29,194 | 26,686 | 26,292 | 24,740 | 25,148 | 22,819 | 21,954 | 23,129 | 21,439 | 25,594 | 28,066 | 30,823 |
| 2003 | 32,628 | 29,744 | 27,309 | 23,316 | 22,015 | 18,602 | 19,268 | 19,980 | 19,576 | 24,052 | 24,733 | 29,260 |
| 2004 | 36,641 | 30,495 | 28,938 | 25,615 | 23,011 | 19,347 | 20,217 | 21,268 | 21,020 | 24,137 | 23,774 | 27,560 |
| 2005 | 31,923 | 29,614 | 29,126 | 24,281 | 22,434 | 20,025 | 19,136 | 21,068 | 20,716 | 21,012 | 24,229 | 30,420 |
| 2006 | 28,224 | 25,471 | 24,749 | 22,099 | 22,468 | 19,921 | 20,214 | 21,459 | 22,886 | 25,535 | 25,568 | 27,894 |
| 2007 | 29,455 | 31,868 | 27,921 | 24,888 | 21,874 | 20,202 | 19,450 | 20,910 | 20,491 | 21,988 | 25,288 | 29,640 |
| 2008 | 31,536 | 30,828 | 29,783 | 24,275 | 22,651 | 21,116 | 19,531 | 19,839 | 18,810 | 18,974 | 21,369 | 24,123 |
| 2009 | 27,791 | 23,579 | 21,677 | 17,992 | 15,299 | 14,453 | 15,165 | 15,802 | 16,169 | 18,918 | 20,633 | 25,152 |
| 2010 | 28,220 | 26,853 | 24,759 | 22,422 | 20,900 | 19,941 | 20,314 | 19,295 | 18,039 | 21,314 | 21,345 | 25,884 |
| 2011 | 28,703 | 26,865 | 25,978 | 22,712 | 20,208 | 19,142 | 18,260 | 18,943 | 18,336 | 20,935 | 22,779 | 25,171 |
| 2012 | 27,095 | 25,977 | 23,312 | 21,949 | 20,826 | 19,646 | 18,088 | 19,784 | 19,892 | 20,832 | 22,557 | 24,448 |
| 2013 | 27,109 | 26,423 | 26,975 | 22,811 | 20,640 | 19,837 | 18,766 | 19,854 | 19,169 | 20,809 | 24,271 | 27,355 |
| 2014 | 32,272 | 30,125 | 29,069 | 24,434 | 21,392 | 22,033 | 22,888 | 22,950 | 22,786 | 23,090 | 24,717 | 27,609 |
| 2015 | 31,300 | 30,802 | 28,217 | 22,803 | 20,431 | 19,413 | 19,463 | 19,080 | 18,521 | 20,128 | 22,474 | 23,373 |
| 2016 | 29,762 | 27,286 | 24,852 | 22,601 | 21,364 | 19,658 | 19,109 | 18,882 | 19,318 | 21,355 | 23,434 | 27,736 |
| 2017 | 28,801 | 25,589 | 26,464 | 22,340 | 21,225 | 18,754 | 19,163 | 19,487 | 20,499 | 21,331 | 25,226 | 28,889 |
| 2018 | 33,298 | 29,304 | 29,428 | 26,922 | 23,660 | 22,186 | 21,185 | 21,246 | 21,538 | 23,582 | 26,772 | 30,060 |
| 2019 | 33,210 | 29,521 | 30,356 | 24,648 | 22,421 | 17,190 | 21,042 | 21,691 | 21,212 | 22,239 | 26,635 | 28,007 |
| 2020 | 30,014 | 29,266 | 27,187 | 23,562 | 19,848 | 18,461 | 20,060 | 20,354 | 18,665 | 22,899 | 23,740 | 27,946 |
| 2021 | 30,725 | 31,463 | 30,011 | 26,336 | 22,860 | 21,257 | 21,760 | 22,583 | 22,433 | 22,956 | 29,627 | 28,009 |
| 2022 | 33,742 | 30,786 | 29,610 | 26,051 | 22,642 | 20,405 | 20,403 | 21,638 | 22,450 | 25,539 | 27,660 | 31,025 |
| 2023 | 30,934 | 29,990 | 30,227 | 26,958 | 26,064 | 21,592 | 22,697 | 23,860 | 21,534 | 25,699 | 29,135 | 31,209 |
| 2024 | 35,861 | 29,522 | 30,163 | 26,808 | 24,429 | 23,734 | 23,763 | 23,877 | 23,788 | 24,488 | 27,751 | 29,075 |
| 2025 | 35,788 | 32,557 | 30,138 | 27,631 | 24,761 | 22,347 | 22,537 | 22,956 | 22,255 | 25,928 | 31,157 | 34,696 |
| 2026 | 37,060 | 33,305 | 31,559 | 28,897 | ||||||||
| - = No Data Reported; -- = Not Applicable; NA = Not Available; W = Withheld to avoid disclosure of individual company data. |
| Release Date: 6/30/2026 |
| Next Release Date: 7/31/2026 |