|
Download Data (XLS File) |
|
||||||||
|
||||||||
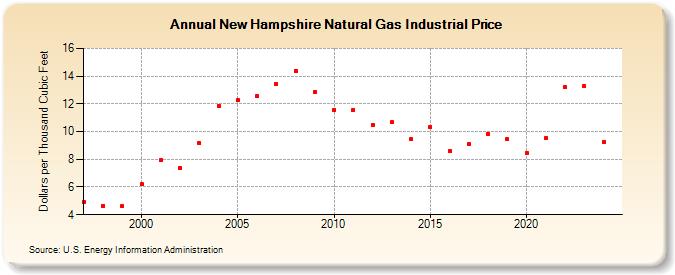
| New Hampshire Natural Gas Industrial Price (Dollars per Thousand Cubic Feet) | ||||||||
| Decade | Year-0 | Year-1 | Year-2 | Year-3 | Year-4 | Year-5 | Year-6 | Year-7 | Year-8 | Year-9 |
|---|---|---|---|---|---|---|---|---|---|---|
| 1990's | 4.90 | 4.66 | 4.60 | |||||||
| 2000's | 6.18 | 7.92 | 7.38 | 9.17 | 11.86 | 12.25 | 12.55 | 13.45 | 14.37 | 12.86 |
| 2010's | 11.59 | 11.57 | 10.48 | 10.68 | 9.46 | 10.33 | 8.59 | 9.09 | 9.81 | 9.45 |
| 2020's | 8.47 | 9.53 | 13.19 | 13.26 | 9.28 | 10.00 |
| - = No Data Reported; -- = Not Applicable; NA = Not Available; W = Withheld to avoid disclosure of individual company data. |
| Release Date: 7/31/2026 |
| Next Release Date: 8/31/2026 |