|
Download Data (XLS File) |
|
||||||||
|
||||||||
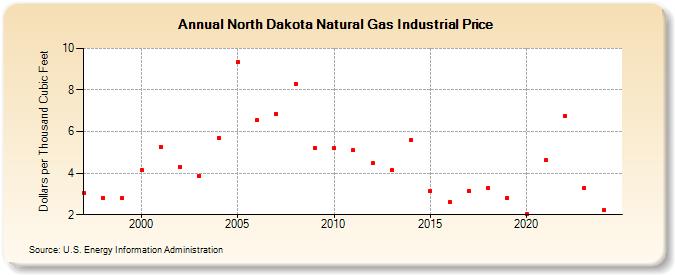
| North Dakota Natural Gas Industrial Price (Dollars per Thousand Cubic Feet) | ||||||||
| Decade | Year-0 | Year-1 | Year-2 | Year-3 | Year-4 | Year-5 | Year-6 | Year-7 | Year-8 | Year-9 |
|---|---|---|---|---|---|---|---|---|---|---|
| 1990's | 3.05 | 2.82 | 2.80 | |||||||
| 2000's | 4.14 | 5.27 | 4.31 | 3.88 | 5.70 | 9.34 | 6.54 | 6.86 | 8.30 | 5.21 |
| 2010's | 5.22 | 5.10 | 4.48 | 4.14 | 5.61 | 3.13 | 2.62 | 3.15 | 3.29 | 2.82 |
| 2020's | 2.04 | 4.63 | 6.75 | 3.29 | 2.21 | 3.44 |
| - = No Data Reported; -- = Not Applicable; NA = Not Available; W = Withheld to avoid disclosure of individual company data. |
| Release Date: 6/30/2026 |
| Next Release Date: 7/31/2026 |