|
Download Data (XLS File) |
|
||||||||
|
||||||||
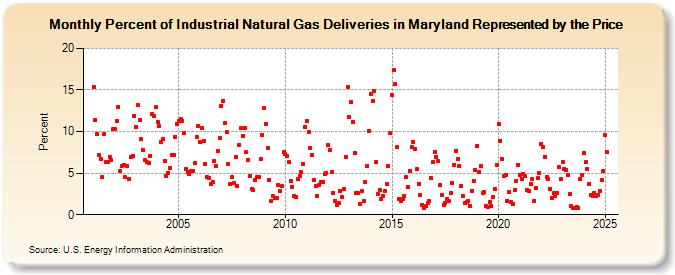
| Percent of Industrial Natural Gas Deliveries in Maryland Represented by the Price (Percent) | ||||||||
| Year | Jan | Feb | Mar | Apr | May | Jun | Jul | Aug | Sep | Oct | Nov | Dec |
|---|---|---|---|---|---|---|---|---|---|---|---|---|
| 2001 | 15.4 | 11.4 | 9.7 | 7.2 | 6.7 | 4.5 | 9.7 | 6.3 | 6.3 | 7.0 | 6.6 | 10.3 |
| 2002 | 10.3 | 11.3 | 13.0 | 5.3 | 5.8 | 6.0 | 4.5 | 5.8 | 4.3 | 6.9 | 7.1 | 11.9 |
| 2003 | 10.5 | 13.2 | 11.4 | 9.1 | 7.8 | 6.6 | 6.3 | 6.2 | 7.1 | 12.1 | 11.9 | 12.9 |
| 2004 | 11.2 | 10.7 | 8.8 | 9.1 | 6.4 | 4.7 | 5.0 | 5.6 | 7.2 | 7.2 | 9.4 | 10.9 |
| 2005 | 11.3 | 11.5 | 11.3 | 9.8 | 5.5 | 5.1 | 4.9 | 5.3 | 5.2 | 6.2 | 9.4 | 10.7 |
| 2006 | 8.7 | 10.4 | 8.9 | 6.1 | 4.5 | 4.4 | 3.7 | 3.9 | 6.5 | 5.8 | 7.7 | 9.2 |
| 2007 | 13.1 | 13.7 | 11.0 | 9.9 | 6.1 | 3.7 | 4.5 | 3.8 | 6.9 | 3.5 | 8.4 | 10.4 |
| 2008 | 9.5 | 10.4 | 7.5 | 6.6 | 4.7 | 3.1 | 3.0 | 4.2 | 4.5 | 4.5 | 6.7 | 9.6 |
| 2009 | 12.8 | 10.9 | 8.0 | 4.2 | 1.7 | 2.2 | 2.0 | 2.0 | 3.6 | 2.8 | 3.4 | 7.6 |
| 2010 | 7.3 | 7.1 | 6.3 | 4.1 | 3.3 | 2.3 | 2.1 | 4.3 | 4.6 | 5.1 | 6.1 | 10.6 |
| 2011 | 11.3 | 10.0 | 8.0 | 7.2 | 4.2 | 3.5 | 2.2 | 3.6 | 3.9 | 3.9 | 4.9 | 5.0 |
| 2012 | 8.4 | 7.8 | 5.1 | 2.6 | 1.7 | 1.2 | 1.4 | 2.9 | 2.1 | 3.1 | 7.0 | 15.4 |
| 2013 | 11.8 | 13.6 | 11.2 | 7.4 | 2.6 | 2.6 | 1.3 | 2.8 | 1.6 | 3.9 | 5.9 | 10.1 |
| 2014 | 14.5 | 13.7 | 14.9 | 6.3 | 2.5 | 3.0 | 1.9 | 2.3 | 2.9 | 3.7 | 5.9 | 9.8 |
| 2015 | 14.4 | 17.4 | 15.7 | 8.1 | 1.9 | 1.6 | 1.9 | 2.3 | 4.5 | 3.3 | 5.3 | 8.2 |
| 2016 | 8.8 | 7.9 | 5.5 | 3.7 | 2.4 | 1.2 | 0.8 | 1.0 | 1.4 | 1.6 | 4.4 | 6.3 |
| 2017 | 7.5 | 7.0 | 6.4 | 3.6 | 2.4 | 1.2 | 1.4 | 1.9 | 1.6 | 2.6 | 3.8 | 6.0 |
| 2018 | 7.7 | 6.7 | 5.9 | 3.5 | 2.2 | 1.4 | 1.5 | 1.6 | 1.1 | 2.9 | 4.0 | 5.4 |
| 2019 | 8.3 | 5.1 | 5.9 | 2.6 | 2.7 | 1.0 | 0.9 | 1.5 | 1.1 | 2.1 | 3.1 | 6.0 |
| 2020 | 10.9 | 8.9 | 6.7 | 4.7 | 4.8 | 1.7 | 2.7 | 1.5 | 1.3 | 3.0 | 4.1 | 6.0 |
| 2021 | 4.8 | 4.3 | 4.9 | 4.6 | 3.0 | 2.8 | 3.7 | 4.3 | 1.7 | 3.2 | 4.4 | 5.0 |
| 2022 | 8.5 | 8.1 | 7.0 | 4.5 | 4.3 | 3.1 | 2.0 | 2.6 | 2.3 | 2.6 | 5.7 | 4.3 |
| 2023 | 6.2 | 5.5 | 5.4 | 4.7 | 2.5 | 1.1 | 0.9 | 0.9 | 0.9 | 0.8 | 4.3 | 4.8 |
| 2024 | 7.4 | 6.3 | 5.5 | 3.7 | 2.4 | 2.2 | 2.6 | 2.2 | 2.4 | 2.8 | 4.2 | 5.3 |
| 2025 | 9.6 | 7.1 | 5.2 | NA | NA | NA | NA | NA | NA | NA | NA | 4.6 |
| 2026 | NA | NA | NA | NA | ||||||||
| - = No Data Reported; -- = Not Applicable; NA = Not Available; W = Withheld to avoid disclosure of individual company data. |
| Release Date: 6/30/2026 |
| Next Release Date: 7/31/2026 |