|
Download Data (XLS File) |
|
||||||||
|
||||||||
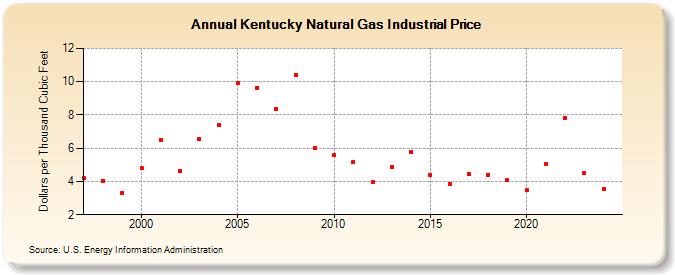
| Kentucky Natural Gas Industrial Price (Dollars per Thousand Cubic Feet) | ||||||||
| Decade | Year-0 | Year-1 | Year-2 | Year-3 | Year-4 | Year-5 | Year-6 | Year-7 | Year-8 | Year-9 |
|---|---|---|---|---|---|---|---|---|---|---|
| 1990's | 4.19 | 4.00 | 3.32 | |||||||
| 2000's | 4.82 | 6.51 | 4.63 | 6.54 | 7.38 | 9.90 | 9.64 | 8.37 | 10.41 | 6.04 |
| 2010's | 5.57 | 5.16 | 3.96 | 4.84 | 5.78 | 4.37 | 3.84 | 4.46 | 4.40 | 4.06 |
| 2020's | 3.50 | 5.04 | 7.84 | 4.49 | 3.66 | NA |
| - = No Data Reported; -- = Not Applicable; NA = Not Available; W = Withheld to avoid disclosure of individual company data. |
| Release Date: 6/30/2026 |
| Next Release Date: 7/31/2026 |