|
Download Data (XLS File) |
|
||||||||
|
||||||||
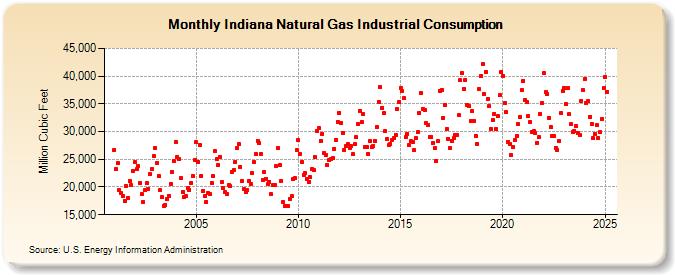
| Indiana Natural Gas Industrial Consumption (Million Cubic Feet) | ||||||||
| Year | Jan | Feb | Mar | Apr | May | Jun | Jul | Aug | Sep | Oct | Nov | Dec |
|---|---|---|---|---|---|---|---|---|---|---|---|---|
| 2001 | 26,677 | 23,164 | 24,258 | 19,456 | 18,831 | 18,369 | 17,553 | 20,171 | 17,971 | 21,014 | 20,330 | 22,971 |
| 2002 | 24,441 | 23,170 | 23,714 | 20,750 | 18,770 | 17,297 | 19,398 | 20,664 | 19,688 | 22,268 | 23,322 | 25,579 |
| 2003 | 27,047 | 24,384 | 21,994 | 19,376 | 18,238 | 16,652 | 16,774 | 17,813 | 18,398 | 20,589 | 22,780 | 24,621 |
| 2004 | 28,155 | 25,447 | 25,012 | 21,558 | 19,052 | 18,264 | 18,325 | 19,767 | 19,514 | 20,781 | 22,067 | 24,940 |
| 2005 | 28,069 | 24,575 | 27,661 | 22,009 | 19,346 | 18,322 | 17,340 | 19,005 | 18,711 | 20,639 | 21,908 | 26,437 |
| 2006 | 25,027 | 23,973 | 25,455 | 20,862 | 19,892 | 19,018 | 18,789 | 20,320 | 20,116 | 22,745 | 23,061 | 24,551 |
| 2007 | 27,073 | 27,693 | 23,647 | 21,150 | 19,716 | 19,141 | 19,499 | 21,125 | 20,528 | 22,527 | 24,483 | 25,969 |
| 2008 | 28,360 | 27,875 | 25,951 | 21,259 | 22,673 | 21,522 | 20,502 | 20,948 | 18,652 | 20,345 | 20,410 | 23,714 |
| 2009 | 27,022 | 23,957 | 21,057 | 17,271 | 16,580 | 16,550 | 16,615 | 17,885 | 18,365 | 21,473 | 21,535 | 26,666 |
| 2010 | 28,429 | 25,885 | 24,557 | 22,204 | 22,519 | 21,371 | 20,872 | 21,787 | 23,324 | 22,991 | 25,321 | 30,056 |
| 2011 | 30,559 | 28,374 | 29,634 | 26,111 | 25,851 | 23,902 | 24,850 | 24,997 | 25,181 | 26,878 | 28,487 | 31,748 |
| 2012 | 33,414 | 31,564 | 29,806 | 26,643 | 27,330 | 27,667 | 27,015 | 27,375 | 25,902 | 27,729 | 28,930 | 31,303 |
| 2013 | 33,763 | 31,764 | 33,145 | 27,272 | 27,299 | 26,014 | 28,284 | 27,194 | 27,440 | 28,305 | 30,849 | 35,361 |
| 2014 | 38,039 | 34,324 | 33,264 | 30,014 | 28,579 | 27,553 | 27,773 | 28,557 | 28,836 | 29,439 | 34,107 | 35,301 |
| 2015 | 37,904 | 37,319 | 36,014 | 29,054 | 29,593 | 27,518 | 28,246 | 28,121 | 26,669 | 28,801 | 29,891 | 33,407 |
| 2016 | 36,930 | 34,111 | 33,805 | 31,458 | 31,205 | 29,036 | 29,019 | 27,964 | 27,079 | 24,640 | 28,293 | 37,404 |
| 2017 | 37,541 | 32,493 | 34,791 | 30,512 | 28,710 | 27,053 | 28,380 | 28,797 | 29,293 | 29,357 | 32,908 | 39,283 |
| 2018 | 40,509 | 37,664 | 39,358 | 34,777 | 34,594 | 31,886 | 33,660 | 31,926 | 29,271 | 27,802 | 37,710 | 39,990 |
| 2019 | 42,103 | 36,785 | 40,810 | 35,898 | 34,525 | 30,495 | 32,105 | 33,212 | 30,499 | 32,744 | 36,515 | 40,716 |
| 2020 | 40,072 | 35,134 | 33,485 | 28,179 | 27,844 | 25,736 | 27,176 | 28,515 | 29,182 | 31,359 | 32,712 | 37,519 |
| 2021 | 39,131 | 35,698 | 35,366 | 32,716 | 31,752 | 29,919 | 30,129 | 29,744 | 28,014 | 29,000 | 33,193 | 35,136 |
| 2022 | 40,559 | 37,064 | 36,766 | 32,525 | 30,758 | 29,276 | 29,139 | 27,109 | 26,648 | 28,239 | 33,380 | 37,363 |
| 2023 | 37,946 | 34,945 | 37,795 | 33,106 | 31,278 | 29,921 | 30,118 | 30,960 | 29,783 | 29,325 | 35,520 | 37,481 |
| 2024 | 39,804 | 35,392 | 35,734 | 32,972 | 31,629 | 29,013 | 29,864 | 31,395 | 29,098 | 30,162 | 32,588 | 38,175 |
| 2025 | 40,137 | 37,433 | 37,831 | 33,375 | 32,356 | 30,935 | 32,062 | 30,536 | 30,448 | 29,410 | 34,732 | 40,584 |
| 2026 | 42,366 | 36,686 | NA | NA | ||||||||
| - = No Data Reported; -- = Not Applicable; NA = Not Available; W = Withheld to avoid disclosure of individual company data. |
| Release Date: 6/30/2026 |
| Next Release Date: 7/31/2026 |