|
Download Data (XLS File) |
|
||||||||
|
||||||||
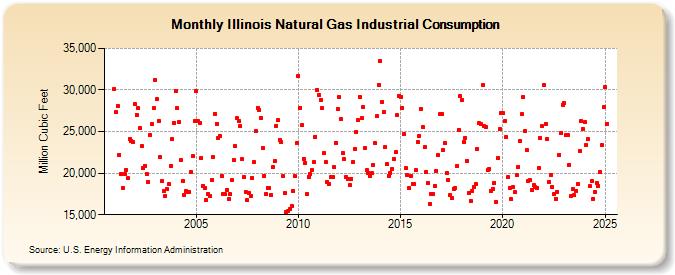
| Illinois Natural Gas Industrial Consumption (Million Cubic Feet) | ||||||||
| Year | Jan | Feb | Mar | Apr | May | Jun | Jul | Aug | Sep | Oct | Nov | Dec |
|---|---|---|---|---|---|---|---|---|---|---|---|---|
| 2001 | 30,126 | 27,294 | 28,116 | 22,192 | 19,913 | 18,238 | 19,905 | 20,406 | 19,383 | 24,125 | 23,899 | 23,695 |
| 2002 | 28,312 | 26,992 | 27,788 | 25,387 | 23,234 | 20,581 | 20,901 | 19,953 | 18,993 | 24,645 | 25,907 | 27,786 |
| 2003 | 31,254 | 28,899 | 26,298 | 21,911 | 19,034 | 17,861 | 17,230 | 18,104 | 18,657 | 20,858 | 24,087 | 26,077 |
| 2004 | 29,852 | 27,792 | 26,094 | 21,637 | 18,997 | 17,420 | 17,806 | 17,754 | 17,735 | 20,119 | 22,025 | 26,251 |
| 2005 | 29,846 | 26,239 | 26,061 | 21,818 | 18,504 | 18,254 | 16,787 | 17,517 | 17,260 | 19,192 | 21,892 | 27,167 |
| 2006 | 25,954 | 24,272 | 24,460 | 19,712 | 17,441 | 17,451 | 17,952 | 16,834 | 17,437 | 19,133 | 21,614 | 23,228 |
| 2007 | 26,574 | 26,302 | 25,666 | 21,667 | 19,541 | 17,770 | 16,719 | 17,614 | 17,242 | 19,408 | 21,335 | 25,034 |
| 2008 | 27,875 | 27,607 | 26,652 | 23,019 | 19,690 | 17,490 | 18,234 | 18,211 | 17,345 | 20,732 | 21,437 | 25,716 |
| 2009 | 26,367 | 24,038 | 23,736 | 19,636 | 17,588 | 15,351 | 15,481 | 15,696 | 16,064 | 17,837 | 19,629 | 23,621 |
| 2010 | 31,740 | 27,891 | 25,790 | 21,738 | 21,263 | 17,442 | 19,592 | 19,836 | 20,377 | 21,331 | 24,378 | 30,027 |
| 2011 | 29,385 | 28,834 | 27,796 | 22,394 | 21,351 | 18,936 | 18,705 | 19,485 | 19,502 | 20,729 | 23,675 | 27,705 |
| 2012 | 29,142 | 26,478 | 22,391 | 21,722 | 19,563 | 19,290 | 18,570 | 19,343 | 21,335 | 22,925 | 24,937 | 26,363 |
| 2013 | 29,186 | 26,602 | 27,961 | 23,031 | 20,324 | 20,043 | 19,651 | 19,963 | 21,007 | 23,623 | 26,834 | 30,650 |
| 2014 | 33,466 | 28,611 | 27,329 | 23,106 | 21,040 | 19,691 | 20,076 | 20,469 | 21,720 | 22,482 | 26,950 | 29,281 |
| 2015 | 29,210 | 27,785 | 24,665 | 20,616 | 19,770 | 18,206 | 19,614 | 18,717 | 18,722 | 20,369 | 23,724 | 24,502 |
| 2016 | 27,716 | 25,499 | 23,105 | 20,144 | 18,791 | 16,347 | 17,546 | 17,490 | 18,509 | 20,311 | 22,155 | 27,068 |
| 2017 | 27,150 | 22,841 | 23,646 | 19,984 | 19,184 | 17,339 | 17,032 | 18,146 | 18,204 | 20,883 | 25,242 | 29,217 |
| 2018 | 28,786 | 23,730 | 24,281 | 21,501 | 17,631 | 16,677 | 17,810 | 18,323 | 18,650 | 22,921 | 25,987 | 25,964 |
| 2019 | 30,549 | 25,660 | 25,555 | 20,356 | 20,552 | 17,905 | 18,098 | 18,852 | 16,582 | 21,826 | 25,330 | 27,221 |
| 2020 | 27,228 | 26,250 | 24,327 | 19,487 | 18,191 | 16,836 | 18,290 | 17,736 | 19,746 | 20,770 | 23,896 | 27,058 |
| 2021 | 29,154 | 25,085 | 22,771 | 19,097 | 19,198 | 17,986 | 18,517 | 18,358 | 18,240 | 20,651 | 24,249 | 25,618 |
| 2022 | 30,588 | 25,910 | 24,118 | 18,990 | 19,754 | 18,362 | 17,441 | 16,939 | 17,766 | 22,225 | 24,766 | 28,224 |
| 2023 | 28,415 | 24,552 | 24,548 | 21,030 | 17,252 | 18,052 | 17,324 | 17,894 | 18,734 | 22,604 | 26,227 | 25,302 |
| 2024 | 26,853 | 23,335 | 24,013 | 18,394 | 19,073 | 16,916 | 17,738 | 18,817 | 18,464 | 20,158 | 23,304 | 27,872 |
| 2025 | 29,885 | 25,562 | 21,611 | 19,433 | 17,808 | 16,462 | 16,515 | 16,771 | 17,544 | 21,079 | 23,713 | 27,192 |
| 2026 | 28,488 | 21,256 | 22,432 | 17,880 | ||||||||
| - = No Data Reported; -- = Not Applicable; NA = Not Available; W = Withheld to avoid disclosure of individual company data. |
| Release Date: 6/30/2026 |
| Next Release Date: 7/31/2026 |