|
Download Data (XLS File) |
|
||||||||
|
||||||||
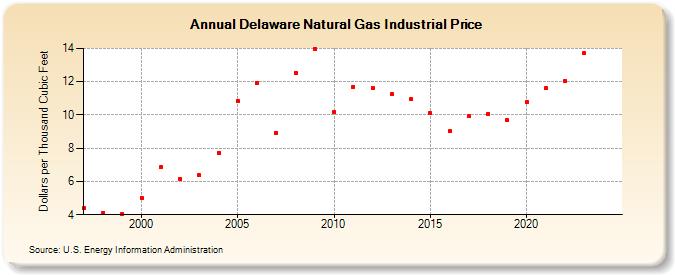
| Delaware Natural Gas Industrial Price (Dollars per Thousand Cubic Feet) | ||||||||
| Decade | Year-0 | Year-1 | Year-2 | Year-3 | Year-4 | Year-5 | Year-6 | Year-7 | Year-8 | Year-9 |
|---|---|---|---|---|---|---|---|---|---|---|
| 1990's | 4.40 | 4.13 | 4.07 | |||||||
| 2000's | 5.03 | 6.85 | 6.16 | 6.37 | 7.72 | 10.86 | 11.94 | 8.93 | 12.54 | 13.99 |
| 2010's | 10.18 | 11.69 | 11.61 | 11.24 | 10.95 | 10.11 | 9.02 | 9.91 | 10.07 | 9.67 |
| 2020's | 10.78 | 11.59 | 12.05 | 13.71 | 10.83 | 12.38 |
| - = No Data Reported; -- = Not Applicable; NA = Not Available; W = Withheld to avoid disclosure of individual company data. |
| Release Date: 7/31/2026 |
| Next Release Date: 8/31/2026 |