|
Download Data (XLS File) |
|
||||||||
|
||||||||
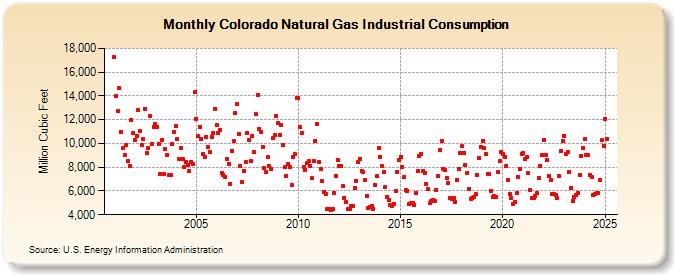
| Colorado Natural Gas Industrial Consumption (Million Cubic Feet) | ||||||||
| Year | Jan | Feb | Mar | Apr | May | Jun | Jul | Aug | Sep | Oct | Nov | Dec |
|---|---|---|---|---|---|---|---|---|---|---|---|---|
| 2001 | 17,268 | 13,981 | 12,731 | 14,667 | 10,985 | 9,633 | 9,063 | 9,888 | 8,555 | 8,139 | 11,955 | 10,843 |
| 2002 | 10,256 | 10,606 | 12,835 | 11,039 | 9,828 | 10,392 | 12,914 | 9,205 | 9,597 | 12,317 | 9,933 | 11,415 |
| 2003 | 11,626 | 11,414 | 9,920 | 7,462 | 10,331 | 7,436 | 9,508 | 9,023 | 7,330 | 7,354 | 9,958 | 10,976 |
| 2004 | 11,434 | 10,376 | 8,694 | 9,635 | 8,728 | 7,987 | 8,460 | 8,200 | 7,683 | 8,441 | 8,231 | 14,305 |
| 2005 | 12,086 | 10,602 | 11,364 | 10,395 | 9,087 | 8,899 | 10,543 | 9,727 | 9,285 | 10,541 | 10,899 | 12,931 |
| 2006 | 11,511 | 10,839 | 11,156 | 7,510 | 7,333 | 7,200 | 8,716 | 8,265 | 6,614 | 9,349 | 10,235 | 12,528 |
| 2007 | 13,296 | 10,830 | 8,124 | 6,784 | 7,705 | 8,474 | 10,890 | 10,258 | 8,494 | 10,644 | 9,292 | 12,438 |
| 2008 | 14,079 | 11,230 | 10,988 | 9,712 | 7,945 | 7,576 | 8,828 | 8,071 | 7,807 | 10,463 | 10,733 | 12,275 |
| 2009 | 11,742 | 10,718 | 11,526 | 9,837 | 7,988 | 7,284 | 8,238 | 8,037 | 6,461 | 8,861 | 9,086 | 13,803 |
| 2010 | 13,828 | 11,352 | 10,879 | 8,020 | 7,798 | 8,331 | 8,523 | 8,080 | 7,084 | 8,515 | 10,236 | 11,649 |
| 2011 | 8,439 | 7,806 | 6,809 | 5,916 | 5,753 | 4,445 | 4,509 | 4,435 | 4,510 | 5,864 | 7,287 | 8,634 |
| 2012 | 8,071 | 8,097 | 6,389 | 5,446 | 5,074 | 4,439 | 4,479 | 4,769 | 4,764 | 6,250 | 6,852 | 8,396 |
| 2013 | 8,717 | 7,719 | 7,610 | 6,893 | 5,609 | 4,572 | 4,627 | 4,697 | 4,503 | 6,509 | 7,236 | 9,588 |
| 2014 | 8,885 | 8,062 | 7,575 | 6,322 | 5,525 | 5,228 | 4,796 | 4,772 | 4,931 | 5,971 | 7,615 | 8,641 |
| 2015 | 8,894 | 8,041 | 7,135 | 6,060 | 5,976 | 4,872 | 5,000 | 4,996 | 4,792 | 5,828 | 7,646 | 8,939 |
| 2016 | 9,126 | 7,705 | 7,543 | 6,624 | 6,141 | 4,982 | 5,117 | 5,245 | 5,165 | 6,109 | 7,221 | 9,453 |
| 2017 | 10,242 | 7,890 | 7,799 | 7,110 | 6,689 | 5,397 | 5,288 | 5,426 | 5,097 | 6,932 | 7,821 | 9,222 |
| 2018 | 9,743 | 9,224 | 8,202 | 7,493 | 6,145 | 5,342 | 5,403 | 5,490 | 5,716 | 7,373 | 8,783 | 9,741 |
| 2019 | 10,231 | 9,591 | 9,148 | 7,445 | 7,405 | 6,001 | 5,483 | 5,535 | 5,517 | 7,606 | 8,486 | 9,245 |
| 2020 | 9,139 | 8,889 | 8,088 | 6,885 | 5,763 | 5,369 | 4,919 | 5,081 | 5,815 | 7,160 | 7,884 | 9,138 |
| 2021 | 9,194 | 8,697 | 8,816 | 7,482 | 6,074 | 5,417 | 5,378 | 5,549 | 5,837 | 7,116 | 8,141 | 9,001 |
| 2022 | 10,261 | 9,048 | 8,568 | 7,293 | 6,892 | 5,715 | 5,710 | 5,680 | 5,385 | 7,231 | 9,371 | 10,238 |
| 2023 | 10,641 | 9,102 | 9,293 | 7,608 | 6,219 | 5,172 | 5,468 | 5,697 | 5,842 | 7,370 | 8,966 | 9,641 |
| 2024 | 10,282 | 8,920 | 8,937 | 7,300 | 7,138 | 5,632 | 5,661 | 5,771 | 5,752 | 6,848 | 10,210 | 9,726 |
| 2025 | 11,922 | 10,243 | 9,516 | 7,787 | 7,763 | 6,112 | 6,285 | 6,496 | 6,364 | NA | 10,183 | 9,863 |
| 2026 | 12,362 | 10,946 | 10,641 | 9,453 | ||||||||
| - = No Data Reported; -- = Not Applicable; NA = Not Available; W = Withheld to avoid disclosure of individual company data. |
| Release Date: 6/30/2026 |
| Next Release Date: 7/31/2026 |