|
Download Data (XLS File) |
|
||||||||
|
||||||||
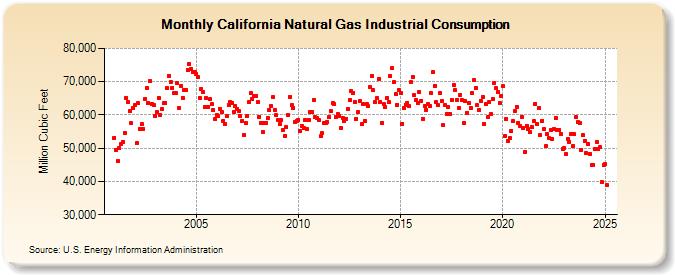
| California Natural Gas Industrial Consumption (Million Cubic Feet) | ||||||||
| Year | Jan | Feb | Mar | Apr | May | Jun | Jul | Aug | Sep | Oct | Nov | Dec |
|---|---|---|---|---|---|---|---|---|---|---|---|---|
| 2001 | 53,179 | 49,474 | 46,193 | 50,003 | 51,398 | 51,983 | 54,565 | 65,128 | 63,833 | 61,177 | 57,442 | 62,087 |
| 2002 | 62,945 | 51,558 | 63,581 | 55,898 | 57,251 | 55,782 | 64,753 | 68,124 | 63,667 | 70,242 | 63,406 | 62,987 |
| 2003 | 59,814 | 60,780 | 65,097 | 59,951 | 61,718 | 63,535 | 63,716 | 68,056 | 71,778 | 69,904 | 68,187 | 66,550 |
| 2004 | 66,480 | 69,591 | 62,162 | 68,688 | 65,201 | 67,632 | 67,551 | 73,433 | 75,362 | 73,862 | 72,814 | 73,046 |
| 2005 | 72,402 | 71,329 | 65,134 | 67,858 | 66,838 | 62,435 | 65,091 | 62,315 | 64,648 | 63,180 | 61,455 | 58,697 |
| 2006 | 60,043 | 59,659 | 61,924 | 60,888 | 58,174 | 57,333 | 59,573 | 62,997 | 64,032 | 63,729 | 60,995 | 62,708 |
| 2007 | 61,788 | 61,141 | 59,722 | 58,301 | 54,001 | 57,444 | 59,539 | 63,863 | 66,575 | 64,899 | 65,574 | 65,655 |
| 2008 | 63,780 | 59,455 | 57,632 | 54,723 | 57,558 | 57,592 | 59,112 | 61,388 | 62,677 | 65,357 | 61,486 | 59,834 |
| 2009 | 58,533 | 57,146 | 58,337 | 55,472 | 53,691 | 56,337 | 59,956 | 65,478 | 62,922 | 62,155 | 57,854 | 58,272 |
| 2010 | 58,425 | 55,257 | 56,815 | 56,011 | 58,425 | 55,626 | 58,568 | 60,767 | 60,774 | 64,500 | 59,298 | 59,072 |
| 2011 | 58,441 | 53,538 | 54,423 | 57,719 | 57,525 | 57,920 | 59,324 | 61,029 | 63,562 | 63,176 | 59,392 | 60,299 |
| 2012 | 59,701 | 56,158 | 59,188 | 58,287 | 58,824 | 61,815 | 64,500 | 67,045 | 66,709 | 63,968 | 58,871 | 60,860 |
| 2013 | 64,113 | 57,150 | 63,427 | 58,222 | 63,188 | 62,622 | 68,447 | 71,691 | 67,354 | 63,894 | 64,981 | 70,882 |
| 2014 | 63,885 | 57,702 | 63,286 | 62,483 | 65,214 | 63,954 | 71,666 | 74,044 | 69,753 | 66,331 | 63,073 | 67,425 |
| 2015 | 66,464 | 57,364 | 62,086 | 63,109 | 63,541 | 62,545 | 69,806 | 71,454 | 65,899 | 64,415 | 63,511 | 66,909 |
| 2016 | 64,278 | 58,878 | 62,641 | 61,518 | 63,228 | 62,672 | 66,480 | 72,768 | 68,838 | 63,793 | 62,917 | 66,492 |
| 2017 | 64,279 | 56,870 | 62,971 | 60,359 | 62,367 | 60,310 | 64,341 | 69,043 | 67,361 | 64,589 | 62,096 | 66,075 |
| 2018 | 64,340 | 57,500 | 64,061 | 60,659 | 63,663 | 62,227 | 66,583 | 70,487 | 68,239 | 62,841 | 61,488 | 64,328 |
| 2019 | 65,438 | 57,327 | 63,355 | 59,312 | 63,860 | 60,273 | 64,900 | 69,610 | 67,982 | 66,872 | 63,595 | 65,665 |
| 2020 | 68,655 | 53,662 | 58,702 | 52,238 | 52,992 | 55,171 | 58,056 | 61,321 | 62,461 | 57,694 | 56,710 | 59,505 |
| 2021 | 56,021 | 48,959 | 56,762 | 55,790 | 54,842 | 56,255 | 58,066 | 63,381 | 57,168 | 62,100 | 53,952 | 58,322 |
| 2022 | 55,621 | 50,519 | 54,342 | 53,020 | 55,365 | 52,739 | 55,712 | 59,127 | 55,419 | 55,460 | 54,292 | 49,689 |
| 2023 | 49,962 | 48,244 | 52,622 | 52,005 | 54,336 | 50,674 | 54,142 | 59,316 | 57,810 | 57,451 | 49,597 | 53,823 |
| 2024 | 52,764 | 48,935 | 51,656 | 48,817 | 45,381 | 45,332 | 50,149 | 52,210 | 50,239 | 50,665 | 40,093 | 45,328 |
| 2025 | 45,718 | 39,232 | 43,553 | 45,679 | 42,764 | 44,203 | 47,151 | 51,755 | 50,389 | 44,882 | 43,583 | 41,738 |
| 2026 | 38,403 | 37,949 | 41,529 | 41,261 | ||||||||
| - = No Data Reported; -- = Not Applicable; NA = Not Available; W = Withheld to avoid disclosure of individual company data. |
| Release Date: 6/30/2026 |
| Next Release Date: 7/31/2026 |