|
Download Data (XLS File) |
|
||||||||
|
||||||||
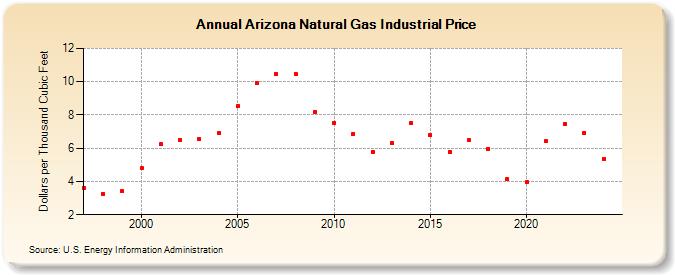
| Arizona Natural Gas Industrial Price (Dollars per Thousand Cubic Feet) | ||||||||
| Decade | Year-0 | Year-1 | Year-2 | Year-3 | Year-4 | Year-5 | Year-6 | Year-7 | Year-8 | Year-9 |
|---|---|---|---|---|---|---|---|---|---|---|
| 1990's | 3.60 | 3.26 | 3.42 | |||||||
| 2000's | 4.79 | 6.23 | 6.49 | 6.54 | 6.91 | 8.53 | 9.90 | 10.49 | 10.47 | 8.19 |
| 2010's | 7.54 | 6.86 | 5.78 | 6.29 | 7.52 | 6.78 | 5.79 | 6.47 | 5.98 | 4.12 |
| 2020's | 3.94 | 6.41 | 7.48 | 6.97 | 5.33 | 4.31 |
| - = No Data Reported; -- = Not Applicable; NA = Not Available; W = Withheld to avoid disclosure of individual company data. |
| Release Date: 6/30/2026 |
| Next Release Date: 7/31/2026 |