|
Download Data (XLS File) |
|
||||||||
|
||||||||
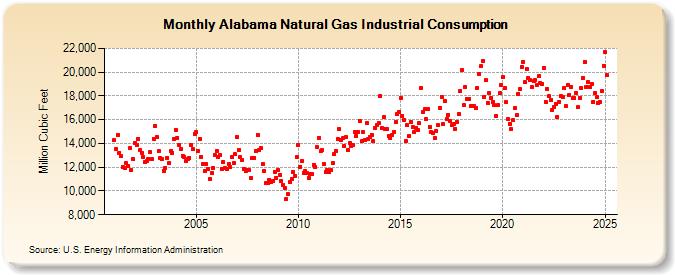
| Alabama Natural Gas Industrial Consumption (Million Cubic Feet) | ||||||||
| Year | Jan | Feb | Mar | Apr | May | Jun | Jul | Aug | Sep | Oct | Nov | Dec |
|---|---|---|---|---|---|---|---|---|---|---|---|---|
| 2001 | 14,252 | 13,534 | 14,746 | 13,227 | 12,911 | 11,989 | 11,891 | 12,319 | 12,134 | 13,613 | 11,767 | 12,672 |
| 2002 | 14,069 | 13,875 | 14,404 | 13,433 | 13,224 | 12,875 | 12,442 | 12,540 | 12,721 | 13,268 | 12,690 | 14,398 |
| 2003 | 15,463 | 14,505 | 13,359 | 12,784 | 12,651 | 11,707 | 11,923 | 12,800 | 12,339 | 13,365 | 13,235 | 14,381 |
| 2004 | 15,170 | 14,489 | 13,878 | 13,567 | 12,955 | 12,878 | 12,557 | 12,722 | 12,800 | 13,906 | 13,521 | 14,812 |
| 2005 | 14,959 | 13,377 | 14,398 | 12,900 | 12,229 | 11,710 | 12,259 | 11,816 | 11,009 | 11,518 | 11,913 | 13,013 |
| 2006 | 13,370 | 12,848 | 13,006 | 11,889 | 12,438 | 11,946 | 11,839 | 12,284 | 12,002 | 12,898 | 12,367 | 13,086 |
| 2007 | 14,536 | 13,470 | 12,857 | 12,592 | 11,866 | 11,659 | 11,798 | 11,727 | 11,086 | 12,745 | 12,814 | 13,336 |
| 2008 | 14,747 | 13,441 | 13,616 | 12,280 | 11,666 | 10,641 | 10,675 | 10,948 | 10,749 | 10,874 | 11,623 | 11,129 |
| 2009 | 11,762 | 11,380 | 10,834 | 10,486 | 10,290 | 9,320 | 9,735 | 10,734 | 10,991 | 11,590 | 11,282 | 12,824 |
| 2010 | 13,864 | 12,056 | 12,525 | 11,512 | 11,662 | 11,501 | 11,083 | 11,404 | 11,437 | 12,215 | 12,006 | 13,672 |
| 2011 | 14,486 | 13,323 | 13,439 | 12,239 | 11,598 | 11,795 | 11,598 | 11,760 | 12,332 | 13,073 | 13,351 | 14,364 |
| 2012 | 15,196 | 14,262 | 14,418 | 13,768 | 14,510 | 13,437 | 14,032 | 13,774 | 13,826 | 14,938 | 14,622 | 14,945 |
| 2013 | 15,925 | 14,170 | 14,940 | 14,283 | 15,714 | 14,392 | 14,573 | 14,745 | 14,175 | 15,310 | 15,559 | 15,726 |
| 2014 | 17,956 | 15,286 | 16,244 | 15,238 | 15,234 | 14,638 | 14,433 | 14,709 | 14,995 | 15,823 | 16,447 | 16,659 |
| 2015 | 17,844 | 16,306 | 15,969 | 14,190 | 15,511 | 14,664 | 15,830 | 15,358 | 14,943 | 15,339 | 15,146 | 15,719 |
| 2016 | 18,689 | 16,687 | 16,861 | 16,023 | 16,896 | 15,396 | 14,949 | 14,876 | 14,459 | 15,062 | 15,519 | 17,008 |
| 2017 | 17,937 | 15,631 | 17,530 | 16,052 | 16,426 | 15,929 | 15,512 | 15,654 | 15,252 | 15,844 | 16,472 | 18,414 |
| 2018 | 20,161 | 17,255 | 18,742 | 17,775 | 17,760 | 17,135 | 17,128 | 17,134 | 16,977 | 18,667 | 19,840 | 20,481 |
| 2019 | 20,939 | 17,930 | 19,316 | 17,426 | 18,233 | 17,864 | 17,497 | 17,207 | 16,330 | 17,208 | 18,204 | 18,886 |
| 2020 | 19,571 | 18,695 | 17,461 | 16,018 | 15,674 | 15,204 | 15,938 | 16,944 | 16,411 | 18,182 | 18,561 | 20,465 |
| 2021 | 20,837 | 19,136 | 20,281 | 19,521 | 19,305 | 18,726 | 19,238 | 19,327 | 18,917 | 19,652 | 19,100 | 19,032 |
| 2022 | 20,379 | 17,516 | 18,609 | 17,974 | 17,691 | 16,817 | 17,048 | 17,309 | 16,189 | 17,509 | 17,962 | 17,940 |
| 2023 | 18,661 | 17,116 | 18,922 | 18,086 | 18,761 | 17,802 | 17,839 | 18,255 | 17,026 | 17,817 | 18,655 | 19,525 |
| 2024 | 21,071 | 18,948 | 19,334 | 18,950 | 19,190 | 17,685 | 18,408 | 18,066 | 17,523 | 17,661 | 19,040 | 20,524 |
| 2025 | 22,599 | 19,919 | 21,123 | 19,628 | 20,388 | 19,934 | 18,653 | 19,099 | 18,865 | 19,257 | 19,637 | 21,434 |
| 2026 | 21,669 | 18,974 | 20,186 | 19,678 | ||||||||
| - = No Data Reported; -- = Not Applicable; NA = Not Available; W = Withheld to avoid disclosure of individual company data. |
| Release Date: 6/30/2026 |
| Next Release Date: 7/31/2026 |