|
Download Data (XLS File) |
|
||||||||
|
||||||||
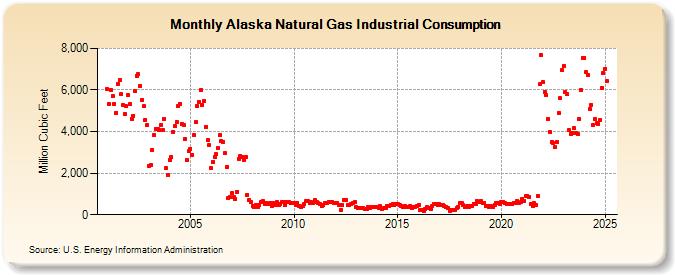
| Alaska Natural Gas Industrial Consumption (Million Cubic Feet) | ||||||||
| Year | Jan | Feb | Mar | Apr | May | Jun | Jul | Aug | Sep | Oct | Nov | Dec |
|---|---|---|---|---|---|---|---|---|---|---|---|---|
| 2001 | 6,025 | 5,327 | 6,001 | 5,721 | 5,333 | 4,909 | 6,300 | 6,462 | 5,784 | 5,263 | 4,843 | 5,205 |
| 2002 | 5,749 | 5,318 | 4,607 | 4,771 | 5,952 | 6,692 | 6,756 | 6,206 | 5,537 | 5,220 | 4,578 | 4,308 |
| 2003 | 2,354 | 2,374 | 3,121 | 3,831 | 4,124 | 4,125 | 4,097 | 4,327 | 4,057 | 4,626 | 2,231 | 1,900 |
| 2004 | 2,655 | 2,775 | 3,983 | 4,253 | 4,470 | 5,222 | 5,348 | 4,387 | 4,325 | 3,650 | 2,622 | 3,051 |
| 2005 | 3,174 | 2,891 | 3,812 | 4,438 | 5,212 | 5,444 | 5,992 | 5,284 | 5,468 | 4,231 | 3,588 | 3,352 |
| 2006 | 2,225 | 2,549 | 2,793 | 2,898 | 3,210 | 3,831 | 3,537 | 3,517 | 2,956 | 2,290 | 818 | 834 |
| 2007 | 1,032 | 831 | 752 | 1,113 | 2,681 | 2,819 | 2,793 | 2,634 | 2,795 | 961 | 711 | 631 |
| 2008 | 436 | 348 | 471 | 387 | 470 | 621 | 655 | 537 | 578 | 494 | 551 | 439 |
| 2009 | 555 | 471 | 599 | 470 | 523 | 597 | 617 | 465 | 589 | 617 | 547 | 585 |
| 2010 | 559 | 491 | 570 | 409 | 385 | 412 | 538 | 671 | 642 | 587 | 589 | 556 |
| 2011 | 694 | 595 | 546 | 536 | 406 | 449 | 555 | 585 | 613 | 597 | 609 | 584 |
| 2012 | 552 | 573 | 480 | 239 | 458 | 718 | 712 | 473 | 472 | 520 | 562 | 598 |
| 2013 | 367 | 326 | 341 | 317 | 306 | 262 | 297 | 370 | 311 | 392 | 384 | 393 |
| 2014 | 361 | 336 | 403 | 283 | 338 | 320 | 427 | 434 | 485 | 508 | 458 | 494 |
| 2015 | 497 | 450 | 439 | 395 | 397 | 376 | 390 | 402 | 345 | 369 | 381 | 422 |
| 2016 | 479 | 243 | 237 | 183 | 261 | 363 | 307 | 261 | 436 | 538 | 493 | 466 |
| 2017 | 502 | 468 | 473 | 403 | 374 | 341 | 200 | 241 | 215 | 239 | 305 | 395 |
| 2018 | 558 | 549 | 459 | 367 | 410 | 379 | 433 | 430 | 531 | 517 | 636 | 620 |
| 2019 | 648 | 557 | 579 | 415 | 404 | 387 | 423 | 385 | 470 | 551 | 583 | 527 |
| 2020 | 612 | 622 | 547 | 510 | 523 | 521 | 515 | 558 | 552 | 670 | 559 | 605 |
| 2021 | 774 | 668 | 892 | 892 | 850 | 524 | 439 | 543 | 485 | 923 | 6,268 | 7,677 |
| 2022 | 6,368 | 5,922 | 5,755 | 4,608 | 3,974 | 3,507 | 3,441 | 3,267 | 3,508 | 4,893 | 5,596 | 6,959 |
| 2023 | 7,146 | 5,903 | 5,798 | 4,060 | 3,898 | 3,949 | 4,155 | 3,911 | 3,901 | 4,593 | 6,022 | 7,547 |
| 2024 | 7,559 | 6,850 | 6,716 | 5,074 | 5,285 | 4,319 | 4,594 | 4,397 | 4,369 | 4,559 | 6,098 | 6,821 |
| 2025 | 7,018 | 6,431 | 6,166 | 4,634 | 4,756 | 4,581 | 3,917 | 4,395 | 4,006 | 4,833 | 5,069 | 6,351 |
| 2026 | 6,486 | 5,537 | 4,805 | 3,158 | ||||||||
| - = No Data Reported; -- = Not Applicable; NA = Not Available; W = Withheld to avoid disclosure of individual company data. |
| Release Date: 6/30/2026 |
| Next Release Date: 7/31/2026 |