|
Download Data (XLS File) |
|
||||||||
|
||||||||
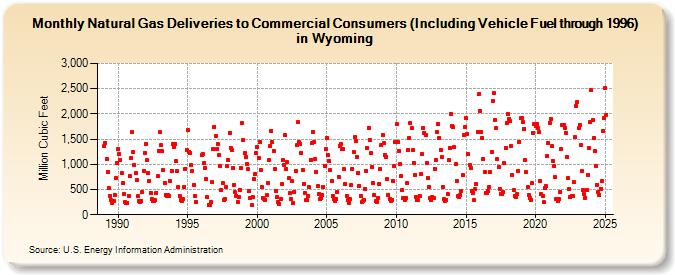
| Natural Gas Deliveries to Commercial Consumers (Including Vehicle Fuel through 1996) in Wyoming (Million Cubic Feet) | ||||||||
| Year | Jan | Feb | Mar | Apr | May | Jun | Jul | Aug | Sep | Oct | Nov | Dec |
|---|---|---|---|---|---|---|---|---|---|---|---|---|
| 1989 | 1,357 | 1,414 | 1,111 | 852 | 521 | 368 | 285 | 233 | 268 | 396 | 724 | 1,022 |
| 1990 | 1,305 | 1,199 | 1,085 | 822 | 628 | 410 | 247 | 234 | 241 | 378 | 759 | 1,132 |
| 1991 | 1,639 | 1,249 | 996 | 830 | 680 | 362 | 272 | 248 | 269 | 449 | 873 | 1,233 |
| 1992 | 1,404 | 1,078 | 821 | 668 | 438 | 309 | 264 | 269 | 287 | 439 | 760 | 1,271 |
| 1993 | 1,631 | 1,376 | 1,262 | 882 | 639 | 400 | 362 | 389 | 378 | 667 | 874 | 1,407 |
| 1994 | 1,351 | 1,412 | 1,065 | 869 | 544 | 369 | 291 | 270 | 308 | 550 | 915 | 1,287 |
| 1995 | 1,671 | 1,247 | 1,217 | 987 | 873 | 594 | 373 | 258 | NA | NA | NA | NA |
| 1996 | 1,176 | 1,203 | 1,030 | 925 | 712 | 342 | 197 | 197 | 250 | 640 | 1,301 | 1,748 |
| 1997 | 1,570 | 1,309 | 1,403 | 1,189 | 958 | 491 | 623 | 287 | 316 | 554 | 966 | 1,088 |
| 1998 | 1,628 | 1,322 | 1,279 | 936 | 597 | 442 | 371 | 253 | 343 | 493 | 927 | 1,822 |
| 1999 | 1,483 | 1,218 | 1,148 | 999 | 901 | 474 | 338 | 189 | 351 | 709 | 802 | 1,224 |
| 2000 | 1,343 | 1,123 | 1,445 | 895 | 545 | 333 | 305 | 300 | 383 | 633 | 1,079 | 1,368 |
| 2001 | 1,666 | 1,435 | 1,261 | 898 | 479 | 352 | 257 | 211 | 311 | 607 | 1,081 | 979 |
| 2002 | 1,578 | 914 | 1,043 | 720 | 425 | 304 | 661 | 235 | 457 | 864 | 1,381 | 1,831 |
| 2003 | 1,433 | 1,409 | 1,234 | 888 | 616 | 426 | 286 | 282 | 368 | 544 | 1,083 | 1,418 |
| 2004 | 1,647 | 1,444 | 1,101 | 850 | 567 | 418 | 319 | 337 | 400 | 559 | 975 | 1,300 |
| 2005 | 1,531 | 1,186 | 1,071 | 878 | 675 | 377 | 306 | 275 | 307 | 455 | 758 | 1,366 |
| 2006 | 1,402 | 1,313 | 1,307 | 910 | 616 | 369 | 294 | 241 | 304 | 584 | 910 | 1,251 |
| 2007 | 1,536 | 1,462 | 1,150 | 837 | 579 | 367 | 246 | 267 | 292 | 512 | 875 | 1,319 |
| 2008 | 1,730 | 1,490 | 1,224 | 944 | 630 | 391 | 271 | 258 | 337 | 610 | 908 | 1,386 |
| 2009 | 1,589 | 1,416 | 1,185 | 1,140 | 702 | 396 | 316 | 271 | 288 | 664 | 970 | 1,434 |
| 2010 | 1,791 | 1,438 | 1,271 | 1,006 | 765 | 487 | 325 | 290 | 333 | 636 | 1,290 | 1,522 |
| 2011 | 1,816 | 1,713 | 1,286 | 1,027 | 794 | 359 | 284 | 288 | 373 | 807 | 1,201 | 1,730 |
| 2012 | 1,628 | 1,577 | 1,026 | 732 | 554 | 334 | 301 | 357 | 335 | 913 | 1,089 | 1,637 |
| 2013 | 1,799 | 1,527 | 1,289 | 1,143 | 558 | 302 | 275 | 292 | 414 | 1,090 | 1,324 | 2,001 |
| 2014 | 1,762 | 1,737 | 1,337 | 1,001 | 670 | 365 | 349 | 389 | 477 | 789 | 1,581 | 1,732 |
| 2015 | 1,913 | 1,603 | 1,196 | 986 | 919 | 461 | 422 | 298 | 503 | 604 | 1,637 | 2,395 |
| 2016 | 2,059 | 1,634 | 1,521 | 1,107 | 856 | 435 | 431 | 467 | 556 | 851 | 1,253 | 2,256 |
| 2017 | 2,405 | 1,884 | 1,713 | 1,098 | 938 | 520 | 409 | 402 | 443 | 1,021 | 1,321 | 1,818 |
| 2018 | 2,007 | 1,908 | 1,857 | 1,368 | 797 | 489 | 376 | 348 | 406 | 870 | 1,448 | 1,913 |
| 2019 | 1,923 | 1,834 | 1,697 | 1,081 | 841 | 558 | 387 | 330 | 294 | 624 | 1,630 | 1,796 |
| 2020 | 1,751 | 1,790 | 1,725 | 1,640 | 660 | 402 | 376 | 244 | 538 | 562 | 1,169 | 1,413 |
| 2021 | 1,829 | 1,905 | 1,355 | 1,070 | 960 | 744 | 310 | 274 | 302 | 455 | 1,301 | 1,789 |
| 2022 | 1,789 | 1,725 | 1,622 | 1,153 | 734 | 520 | 344 | 376 | 375 | 644 | 1,533 | 2,163 |
| 2023 | 2,232 | 1,715 | 1,785 | 1,381 | 863 | 492 | 407 | 341 | 485 | 796 | 1,327 | 1,831 |
| 2024 | 2,213 | 1,685 | 1,358 | 1,134 | 864 | 535 | 395 | 352 | 462 | 597 | 1,491 | 1,717 |
| 2025 | 2,509 | 1,984 | 1,695 | 1,250 | 936 | 571 | 409 | 507 | 528 | 904 | 1,335 | 1,802 |
| 2026 | 2,068 | 1,716 | 1,204 | 992 | ||||||||
| - = No Data Reported; -- = Not Applicable; NA = Not Available; W = Withheld to avoid disclosure of individual company data. |
| Release Date: 6/30/2026 |
| Next Release Date: 7/31/2026 |