|
Download Data (XLS File) |
|
||||||||
|
||||||||
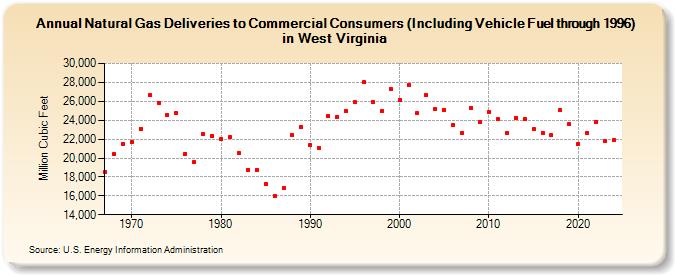
| Natural Gas Deliveries to Commercial Consumers (Including Vehicle Fuel through 1996) in West Virginia (Million Cubic Feet) | ||||||||
| Decade | Year-0 | Year-1 | Year-2 | Year-3 | Year-4 | Year-5 | Year-6 | Year-7 | Year-8 | Year-9 |
|---|---|---|---|---|---|---|---|---|---|---|
| 1960's | 18,511 | 20,402 | 21,534 | |||||||
| 1970's | 21,678 | 23,106 | 26,654 | 25,854 | 24,586 | 24,776 | 20,462 | 19,556 | 22,501 | 22,337 |
| 1980's | 21,980 | 22,191 | 20,548 | 18,771 | 18,780 | 17,224 | 15,995 | 16,792 | 22,416 | 23,258 |
| 1990's | 21,391 | 21,043 | 24,419 | 24,381 | 24,979 | 25,872 | 28,025 | 25,913 | 24,986 | 27,301 |
| 2000's | 26,167 | 27,737 | 24,729 | 26,681 | 25,177 | 25,084 | 23,477 | 22,633 | 25,299 | 23,761 |
| 2010's | 24,907 | 24,094 | 22,634 | 24,252 | 24,101 | 23,026 | 22,698 | 22,421 | 25,059 | 23,599 |
| 2020's | 21,491 | 22,692 | 23,849 | 21,869 | 21,726 | 23,960 |
| - = No Data Reported; -- = Not Applicable; NA = Not Available; W = Withheld to avoid disclosure of individual company data. |
| Release Date: 6/30/2026 |
| Next Release Date: 7/31/2026 |