|
Download Data (XLS File) |
|
||||||||
|
||||||||
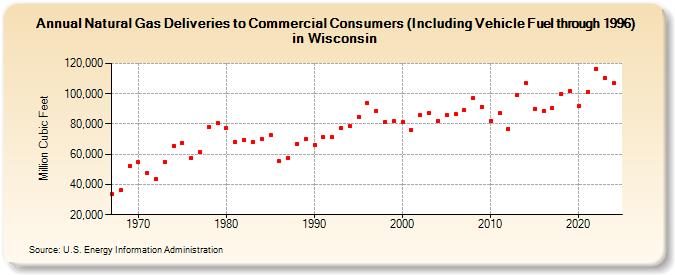
| Natural Gas Deliveries to Commercial Consumers (Including Vehicle Fuel through 1996) in Wisconsin (Million Cubic Feet) | ||||||||
| Decade | Year-0 | Year-1 | Year-2 | Year-3 | Year-4 | Year-5 | Year-6 | Year-7 | Year-8 | Year-9 |
|---|---|---|---|---|---|---|---|---|---|---|
| 1960's | 33,610 | 36,067 | 52,315 | |||||||
| 1970's | 54,555 | 47,662 | 43,753 | 55,012 | 65,705 | 67,485 | 57,702 | 61,280 | 77,890 | 80,756 |
| 1980's | 77,107 | 68,075 | 69,694 | 68,020 | 70,230 | 72,803 | 55,275 | 57,750 | 66,939 | 70,090 |
| 1990's | 66,339 | 71,516 | 71,314 | 77,079 | 78,609 | 84,888 | 93,816 | 88,729 | 81,316 | 81,689 |
| 2000's | 81,139 | 76,095 | 85,811 | 87,131 | 82,187 | 86,086 | 86,342 | 89,016 | 97,137 | 91,459 |
| 2010's | 82,204 | 87,040 | 76,949 | 99,434 | 107,003 | 90,175 | 88,679 | 90,470 | 100,026 | 101,576 |
| 2020's | 91,949 | 100,907 | 116,649 | 110,330 | 106,440 | 118,896 |
| - = No Data Reported; -- = Not Applicable; NA = Not Available; W = Withheld to avoid disclosure of individual company data. |
| Release Date: 6/30/2026 |
| Next Release Date: 7/31/2026 |