|
Download Data (XLS File) |
|
||||||||
|
||||||||
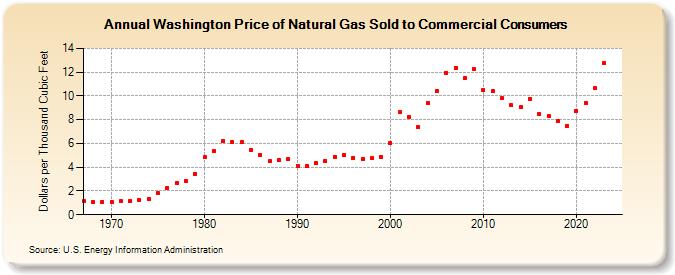
| Washington Price of Natural Gas Sold to Commercial Consumers (Dollars per Thousand Cubic Feet) | ||||||||
| Decade | Year-0 | Year-1 | Year-2 | Year-3 | Year-4 | Year-5 | Year-6 | Year-7 | Year-8 | Year-9 |
|---|---|---|---|---|---|---|---|---|---|---|
| 1960's | 1.15 | 1.09 | 1.10 | |||||||
| 1970's | 1.11 | 1.13 | 1.16 | 1.25 | 1.33 | 1.82 | 2.23 | 2.67 | 2.85 | 3.46 |
| 1980's | 4.83 | 5.35 | 6.21 | 6.08 | 6.08 | 5.45 | 5.05 | 4.50 | 4.59 | 4.68 |
| 1990's | 4.14 | 4.06 | 4.32 | 4.53 | 4.90 | 5.00 | 4.81 | 4.73 | 4.75 | 4.89 |
| 2000's | 6.02 | 8.62 | 8.24 | 7.38 | 9.40 | 10.43 | 11.97 | 12.38 | 11.49 | 12.26 |
| 2010's | 10.49 | 10.40 | 9.82 | 9.21 | 9.03 | 9.78 | 8.49 | 8.30 | 7.90 | 7.49 |
| 2020's | 8.76 | 9.42 | 10.63 | 12.79 | 10.38 | 14.30 |
| - = No Data Reported; -- = Not Applicable; NA = Not Available; W = Withheld to avoid disclosure of individual company data. |
| Release Date: 6/30/2026 |
| Next Release Date: 7/31/2026 |