|
Download Data (XLS File) |
|
||||||||
|
||||||||
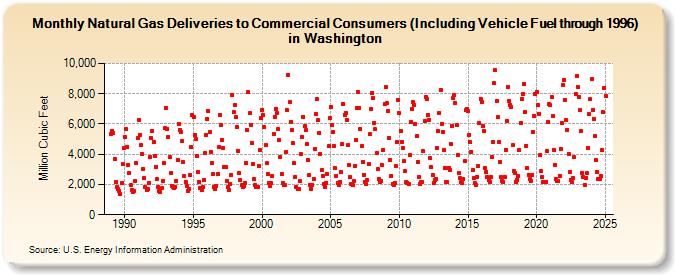
| Natural Gas Deliveries to Commercial Consumers (Including Vehicle Fuel through 1996) in Washington (Million Cubic Feet) | ||||||||
| Year | Jan | Feb | Mar | Apr | May | Jun | Jul | Aug | Sep | Oct | Nov | Dec |
|---|---|---|---|---|---|---|---|---|---|---|---|---|
| 1989 | 5,343 | 5,561 | 5,424 | 3,672 | 2,194 | 1,851 | 1,671 | 1,548 | 1,357 | 2,083 | 3,366 | 4,433 |
| 1990 | 5,136 | 5,666 | 4,496 | 3,289 | 2,728 | 1,951 | 1,639 | 1,476 | 1,575 | 2,249 | 3,444 | 5,071 |
| 1991 | 6,279 | 5,277 | 4,597 | 4,047 | 3,025 | 2,400 | 1,831 | 1,635 | 1,689 | 2,099 | 3,802 | 5,057 |
| 1992 | 5,564 | 4,840 | 3,855 | 3,179 | 2,343 | 1,830 | 1,575 | 1,514 | 1,734 | 2,240 | 3,418 | 5,709 |
| 1993 | 7,058 | 5,670 | 5,157 | 3,785 | 2,774 | 1,905 | 1,801 | 1,750 | 1,829 | 2,236 | 3,639 | 6,016 |
| 1994 | 5,615 | 5,441 | 4,846 | 3,458 | 2,568 | 2,192 | 1,916 | 1,591 | 1,712 | 2,593 | 4,478 | 6,574 |
| 1995 | 6,431 | 5,279 | 5,012 | 3,915 | 2,857 | 2,179 | 1,750 | 1,654 | 1,862 | 2,304 | 4,052 | 5,274 |
| 1996 | 6,316 | 6,833 | 5,450 | 4,147 | 3,434 | 2,672 | 1,857 | 1,697 | 1,920 | 2,701 | 4,489 | 6,623 |
| 1997 | 5,932 | 4,957 | 4,431 | 3,188 | 3,153 | 2,235 | 1,826 | 1,621 | 2,036 | 2,653 | 7,891 | 6,763 |
| 1998 | 7,270 | 6,430 | 5,824 | 4,236 | 2,738 | 2,291 | 1,947 | 1,818 | 1,869 | 2,102 | 3,442 | 5,595 |
| 1999 | 8,109 | 6,701 | 5,957 | 4,751 | 3,344 | 2,356 | 1,965 | 1,813 | 1,851 | 3,239 | 4,278 | 6,369 |
| 2000 | 6,952 | 6,562 | 5,816 | 4,613 | 3,402 | 2,688 | 2,078 | 1,894 | 2,073 | 2,558 | 5,338 | 6,488 |
| 2001 | 7,023 | 6,720 | 5,662 | 4,929 | 3,843 | 2,686 | 2,089 | 1,954 | 1,949 | 4,179 | 6,904 | 9,222 |
| 2002 | 7,431 | 6,149 | 5,619 | 4,723 | 3,416 | 2,506 | 1,828 | 1,680 | 1,707 | 2,243 | 3,995 | 5,158 |
| 2003 | 6,464 | 5,862 | 5,613 | 4,652 | 3,627 | 2,603 | 1,969 | 1,705 | 1,976 | 2,370 | 4,366 | 6,638 |
| 2004 | 7,672 | 6,233 | 5,408 | 4,006 | 2,939 | 2,568 | 2,062 | 1,857 | 2,115 | 2,696 | 4,513 | 6,386 |
| 2005 | 7,133 | 5,901 | 5,476 | 4,553 | 3,068 | 2,588 | 2,099 | 1,953 | 2,169 | 2,798 | 4,670 | 7,337 |
| 2006 | 6,585 | 6,728 | 6,270 | 4,595 | 3,275 | 2,493 | 2,006 | 1,960 | 2,209 | 3,197 | 4,926 | 7,048 |
| 2007 | 8,083 | 7,071 | 5,690 | 4,530 | 3,498 | 2,647 | 2,151 | 2,048 | 2,273 | 3,361 | 5,328 | 7,009 |
| 2008 | 8,032 | 7,693 | 6,091 | 5,639 | 4,083 | 3,008 | 2,372 | 2,163 | 2,233 | 3,261 | 4,298 | 7,332 |
| 2009 | 8,432 | 7,362 | 6,843 | 5,087 | 3,639 | 2,567 | 2,058 | 1,951 | 2,120 | 3,222 | 4,821 | 7,596 |
| 2010 | 6,721 | 5,542 | 4,827 | 4,430 | 3,544 | 2,862 | 2,166 | 2,124 | 2,044 | 3,937 | 6,118 | 7,020 |
| 2011 | 7,463 | 7,272 | 6,012 | 5,178 | 3,510 | 2,521 | 2,048 | 2,133 | 2,166 | 4,200 | 6,197 | 7,787 |
| 2012 | 7,631 | 6,610 | 6,291 | 3,750 | 3,142 | 2,607 | 2,084 | 2,279 | 2,363 | 4,401 | 5,524 | 6,738 |
| 2013 | 8,261 | 6,027 | 5,491 | 4,254 | 3,086 | 2,190 | 2,159 | 3,111 | 2,980 | 4,690 | 5,850 | 7,706 |
| 2014 | 7,891 | 7,396 | 5,900 | 3,942 | 2,774 | 2,427 | 2,162 | 2,112 | 2,385 | 3,523 | 6,923 | 7,023 |
| 2015 | 6,825 | 5,302 | 4,776 | 4,169 | 2,940 | 2,406 | 2,067 | 1,994 | 2,520 | 3,218 | 6,040 | 7,681 |
| 2016 | 7,434 | 5,867 | 5,552 | 3,115 | 2,855 | 2,466 | 2,290 | 2,192 | 2,518 | 3,829 | 4,816 | 8,699 |
| 2017 | 9,551 | 7,492 | 6,433 | 4,786 | 3,506 | 2,464 | 2,222 | 2,172 | 2,514 | 4,296 | 6,197 | 8,464 |
| 2018 | 7,494 | 7,243 | 7,092 | 4,579 | 2,861 | 2,731 | 2,167 | 2,316 | 2,570 | 4,251 | 6,039 | 7,672 |
| 2019 | 8,003 | 8,649 | 6,810 | 4,574 | 3,098 | 2,651 | 2,343 | 2,240 | 2,636 | 5,460 | 6,552 | 7,995 |
| 2020 | 8,139 | 7,254 | 6,660 | 3,974 | 2,858 | 2,499 | 2,182 | 2,141 | 2,193 | 4,188 | 6,154 | 7,306 |
| 2021 | 7,229 | 7,784 | 6,519 | 4,307 | 3,296 | 2,387 | 2,215 | 2,211 | 2,591 | 4,359 | 6,061 | 8,608 |
| 2022 | 8,923 | 7,604 | 6,254 | 5,632 | 4,028 | 2,808 | 2,316 | 2,178 | 2,415 | 3,793 | 7,977 | 9,165 |
| 2023 | 8,450 | 7,794 | 6,906 | 5,548 | 2,744 | 2,496 | 1,983 | 2,435 | 2,734 | 4,445 | 6,633 | 7,628 |
| 2024 | 8,721 | 6,757 | 6,187 | 5,048 | 3,522 | 2,739 | 2,275 | 2,306 | 2,477 | 4,153 | 6,586 | 8,190 |
| 2025 | 9,026 | 7,661 | 6,537 | 4,828 | 3,181 | 2,214 | 2,405 | 2,302 | 2,541 | 4,528 | 5,972 | 7,280 |
| 2026 | 7,700 | 6,452 | 6,352 | 4,668 | ||||||||
| - = No Data Reported; -- = Not Applicable; NA = Not Available; W = Withheld to avoid disclosure of individual company data. |
| Release Date: 6/30/2026 |
| Next Release Date: 7/31/2026 |