|
Download Data (XLS File) |
|
||||||||
|
||||||||
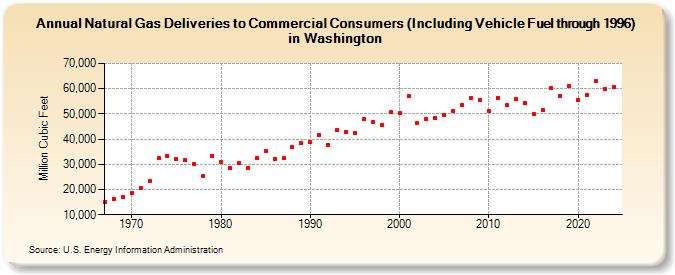
| Natural Gas Deliveries to Commercial Consumers (Including Vehicle Fuel through 1996) in Washington (Million Cubic Feet) | ||||||||
| Decade | Year-0 | Year-1 | Year-2 | Year-3 | Year-4 | Year-5 | Year-6 | Year-7 | Year-8 | Year-9 |
|---|---|---|---|---|---|---|---|---|---|---|
| 1960's | 15,133 | 16,244 | 17,166 | |||||||
| 1970's | 18,490 | 20,612 | 23,254 | 32,333 | 33,221 | 31,988 | 31,652 | 29,946 | 25,330 | 33,369 |
| 1980's | 30,754 | 28,629 | 30,559 | 28,728 | 32,371 | 35,459 | 32,022 | 32,366 | 36,674 | 38,502 |
| 1990's | 38,671 | 41,738 | 37,800 | 43,620 | 42,982 | 42,568 | 48,139 | 46,686 | 45,561 | 50,735 |
| 2000's | 50,462 | 57,160 | 46,455 | 47,845 | 48,455 | 49,745 | 51,292 | 53,689 | 56,205 | 55,697 |
| 2010's | 51,335 | 56,487 | 53,420 | 55,805 | 54,457 | 49,939 | 51,634 | 60,096 | 57,014 | 61,010 |
| 2020's | 55,548 | 57,567 | 63,093 | 59,798 | 58,961 | 58,476 |
| - = No Data Reported; -- = Not Applicable; NA = Not Available; W = Withheld to avoid disclosure of individual company data. |
| Release Date: 4/30/2026 |
| Next Release Date: 5/29/2026 |