|
Download Data (XLS File) |
|
||||||||
|
||||||||
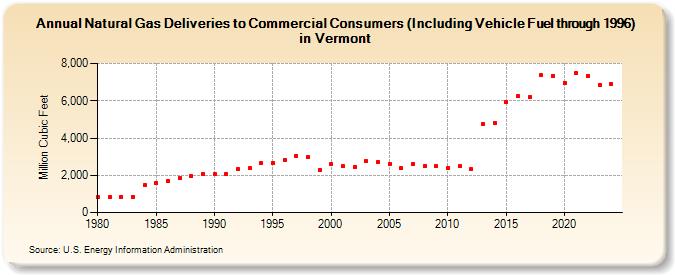
| Natural Gas Deliveries to Commercial Consumers (Including Vehicle Fuel through 1996) in Vermont (Million Cubic Feet) | ||||||||
| Decade | Year-0 | Year-1 | Year-2 | Year-3 | Year-4 | Year-5 | Year-6 | Year-7 | Year-8 | Year-9 |
|---|---|---|---|---|---|---|---|---|---|---|
| 1980's | 828 | 831 | 853 | 856 | 1,467 | 1,575 | 1,688 | 1,833 | 1,941 | 2,081 |
| 1990's | 2,049 | 2,058 | 2,319 | 2,382 | 2,669 | 2,672 | 2,825 | 3,051 | 2,979 | 2,309 |
| 2000's | 2,595 | 2,473 | 2,470 | 2,757 | 2,724 | 2,610 | 2,374 | 2,631 | 2,495 | 2,483 |
| 2010's | 2,384 | 2,479 | 2,314 | 4,748 | 4,830 | 5,918 | 6,251 | 6,205 | 7,356 | 7,341 |
| 2020's | 6,974 | 7,479 | 7,353 | 6,859 | 6,844 | 7,339 |
| - = No Data Reported; -- = Not Applicable; NA = Not Available; W = Withheld to avoid disclosure of individual company data. |
| Release Date: 6/30/2026 |
| Next Release Date: 7/31/2026 |