|
Download Data (XLS File) |
|
||||||||
|
||||||||
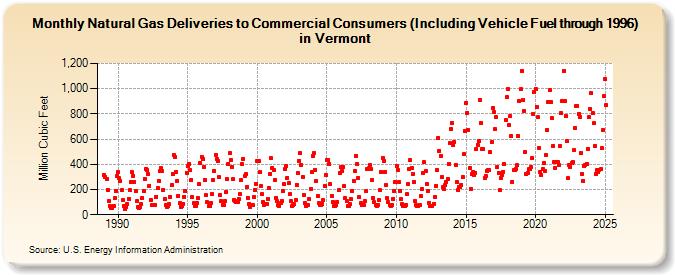
| Natural Gas Deliveries to Commercial Consumers (Including Vehicle Fuel through 1996) in Vermont (Million Cubic Feet) | ||||||||
| Year | Jan | Feb | Mar | Apr | May | Jun | Jul | Aug | Sep | Oct | Nov | Dec |
|---|---|---|---|---|---|---|---|---|---|---|---|---|
| 1989 | 315 | 300 | 283 | 199 | 105 | 66 | 57 | 57 | 73 | 130 | 189 | 307 |
| 1990 | 338 | 288 | 269 | 196 | 116 | 68 | 46 | 62 | 84 | 127 | 195 | 261 |
| 1991 | 335 | 311 | 259 | 187 | 105 | 61 | 55 | 58 | 82 | 133 | 188 | 284 |
| 1992 | 366 | 354 | 320 | 231 | 118 | 75 | 79 | 75 | 77 | 144 | 211 | 269 |
| 1993 | 347 | 368 | 350 | 199 | 124 | 80 | 62 | 67 | 83 | 143 | 235 | 324 |
| 1994 | 476 | 455 | 341 | 269 | 150 | 90 | 65 | 69 | 88 | 144 | 187 | 334 |
| 1995 | 388 | 406 | 352 | 277 | 140 | 89 | 70 | 72 | 95 | 130 | 242 | 410 |
| 1996 | 458 | 445 | 381 | 279 | 153 | 97 | 67 | 69 | 90 | 162 | 276 | 348 |
| 1997 | 477 | 444 | 429 | 296 | 160 | 108 | 80 | 80 | 108 | 184 | 282 | 403 |
| 1998 | 487 | 436 | 381 | 281 | 116 | 110 | 102 | 100 | 125 | 165 | 276 | 401 |
| 1999 | 443 | 308 | 320 | 218 | 135 | 87 | 63 | 74 | 77 | 137 | 200 | 247 |
| 2000 | 425 | 428 | 337 | 227 | 161 | 102 | 81 | 82 | 87 | 127 | 212 | 327 |
| 2001 | 447 | 374 | 356 | 276 | 136 | 108 | 74 | 72 | 92 | 108 | 189 | 241 |
| 2002 | 362 | 383 | 294 | 249 | 161 | 108 | 72 | 75 | 83 | 114 | 238 | 332 |
| 2003 | 429 | 486 | 397 | 302 | 157 | 94 | 71 | 75 | 76 | 125 | 207 | 337 |
| 2004 | 466 | 491 | 355 | 267 | 151 | 93 | 76 | 78 | 88 | 113 | 229 | 316 |
| 2005 | 435 | 432 | 402 | 240 | 149 | 101 | 69 | 73 | 78 | 101 | 196 | 332 |
| 2006 | 375 | 350 | 379 | 226 | 132 | 109 | 66 | 71 | 83 | 124 | 190 | 268 |
| 2007 | 348 | 468 | 405 | 294 | 139 | 91 | 77 | 77 | 77 | 105 | 186 | 365 |
| 2008 | 367 | 391 | 361 | 272 | 134 | 98 | 74 | 72 | 81 | 115 | 193 | 337 |
| 2009 | 449 | 428 | 341 | 236 | 131 | 98 | 76 | 73 | 77 | 125 | 190 | 259 |
| 2010 | 389 | 356 | 259 | 190 | 121 | 86 | 68 | 71 | 79 | 161 | 242 | 362 |
| 2011 | 431 | 373 | 326 | 263 | 106 | 74 | 67 | 73 | 80 | 151 | 203 | 330 |
| 2012 | 416 | 345 | 246 | 188 | 96 | 69 | 70 | 72 | 87 | 144 | 229 | 353 |
| 2013 | 611 | 509 | 468 | 300 | 216 | 204 | 238 | 262 | 284 | 405 | 569 | 682 |
| 2014 | 727 | 551 | 575 | 393 | 259 | 199 | 218 | 223 | 239 | 300 | 479 | 666 |
| 2015 | 889 | 810 | 675 | 370 | 204 | 323 | 340 | 316 | 334 | 520 | 554 | 583 |
| 2016 | 911 | 724 | 523 | 520 | 290 | 310 | 350 | 355 | 353 | 495 | 575 | 845 |
| 2017 | 814 | 678 | 774 | 375 | 332 | 194 | 292 | 317 | 342 | 401 | 752 | 932 |
| 2018 | 998 | 710 | 783 | 623 | 262 | 353 | 353 | 363 | 392 | 626 | 899 | 994 |
| 2019 | 1,142 | 911 | 820 | 498 | 321 | 332 | 360 | 362 | 375 | 450 | 800 | 972 |
| 2020 | 999 | 855 | 772 | 533 | 340 | 314 | 362 | 409 | 347 | 475 | 676 | 892 |
| 2021 | 988 | 894 | 768 | 546 | 420 | 369 | 418 | 420 | 396 | 546 | 807 | 906 |
| 2022 | 1,143 | 900 | 780 | 582 | 288 | 393 | 379 | 408 | 415 | 511 | 691 | 863 |
| 2023 | 861 | 803 | 776 | 490 | 327 | 269 | 390 | 397 | 404 | 525 | 775 | 842 |
| 2024 | 953 | 801 | 717 | 541 | 322 | 349 | 333 | 353 | 355 | 523 | 666 | 931 |
| 2025 | 1,073 | 869 | 728 | 565 | 327 | 337 | 363 | 378 | 384 | 530 | 755 | 1,029 |
| 2026 | 930 | 833 | 797 | 539 | ||||||||
| - = No Data Reported; -- = Not Applicable; NA = Not Available; W = Withheld to avoid disclosure of individual company data. |
| Release Date: 6/30/2026 |
| Next Release Date: 7/31/2026 |