|
Download Data (XLS File) |
|
||||||||
|
||||||||
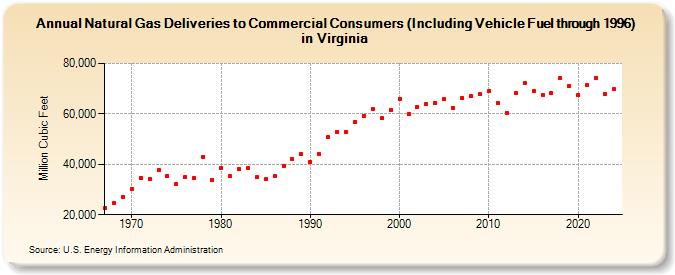
| Natural Gas Deliveries to Commercial Consumers (Including Vehicle Fuel through 1996) in Virginia (Million Cubic Feet) | ||||||||
| Decade | Year-0 | Year-1 | Year-2 | Year-3 | Year-4 | Year-5 | Year-6 | Year-7 | Year-8 | Year-9 |
|---|---|---|---|---|---|---|---|---|---|---|
| 1960's | 22,756 | 24,594 | 27,155 | |||||||
| 1970's | 30,090 | 34,672 | 34,176 | 37,632 | 35,281 | 32,358 | 34,887 | 34,685 | 43,064 | 33,946 |
| 1980's | 38,467 | 35,255 | 38,157 | 38,457 | 34,825 | 33,975 | 35,453 | 39,401 | 42,013 | 44,181 |
| 1990's | 41,038 | 44,077 | 50,757 | 52,880 | 52,944 | 56,948 | 59,262 | 61,895 | 58,283 | 61,516 |
| 2000's | 66,098 | 59,809 | 62,699 | 64,004 | 64,518 | 65,838 | 62,352 | 66,444 | 67,006 | 67,709 |
| 2010's | 68,911 | 64,282 | 60,217 | 68,126 | 72,165 | 69,107 | 67,553 | 68,162 | 74,282 | 71,245 |
| 2020's | 67,529 | 71,331 | 74,390 | 67,752 | 69,823 | 73,940 |
| - = No Data Reported; -- = Not Applicable; NA = Not Available; W = Withheld to avoid disclosure of individual company data. |
| Release Date: 6/30/2026 |
| Next Release Date: 7/31/2026 |