|
Download Data (XLS File) |
|
||||||||
|
||||||||
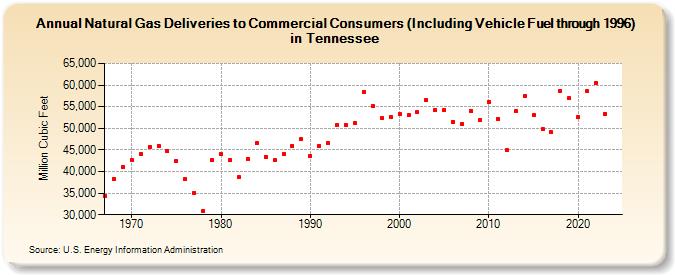
| Natural Gas Deliveries to Commercial Consumers (Including Vehicle Fuel through 1996) in Tennessee (Million Cubic Feet) | ||||||||
| Decade | Year-0 | Year-1 | Year-2 | Year-3 | Year-4 | Year-5 | Year-6 | Year-7 | Year-8 | Year-9 |
|---|---|---|---|---|---|---|---|---|---|---|
| 1960's | 34,380 | 38,325 | 41,069 | |||||||
| 1970's | 42,720 | 44,062 | 45,704 | 45,974 | 44,651 | 42,488 | 38,244 | 35,127 | 30,917 | 42,714 |
| 1980's | 44,048 | 42,686 | 38,697 | 42,903 | 46,544 | 43,399 | 42,589 | 44,144 | 45,852 | 47,513 |
| 1990's | 43,552 | 45,953 | 46,532 | 50,754 | 50,760 | 51,235 | 58,497 | 55,117 | 52,394 | 52,572 |
| 2000's | 53,365 | 53,010 | 53,710 | 56,576 | 54,201 | 54,264 | 51,537 | 51,056 | 54,094 | 51,879 |
| 2010's | 56,194 | 52,156 | 44,928 | 53,888 | 57,435 | 53,049 | 49,809 | 49,042 | 58,669 | 56,916 |
| 2020's | 52,565 | 58,564 | 60,487 | 53,555 | 57,209 | 64,577 |
| - = No Data Reported; -- = Not Applicable; NA = Not Available; W = Withheld to avoid disclosure of individual company data. |
| Release Date: 6/30/2026 |
| Next Release Date: 7/31/2026 |