|
Download Data (XLS File) |
|
||||||||
|
||||||||
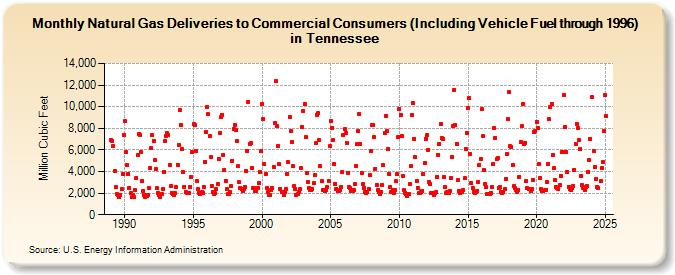
| Natural Gas Deliveries to Commercial Consumers (Including Vehicle Fuel through 1996) in Tennessee (Million Cubic Feet) | ||||||||
| Year | Jan | Feb | Mar | Apr | May | Jun | Jul | Aug | Sep | Oct | Nov | Dec |
|---|---|---|---|---|---|---|---|---|---|---|---|---|
| 1989 | 6,960 | 6,840 | 6,382 | 4,054 | 2,529 | 1,916 | 1,802 | 1,659 | 1,843 | 2,355 | 3,769 | 7,404 |
| 1990 | 8,672 | 5,800 | 4,578 | 3,811 | 2,474 | 1,988 | 1,652 | 1,791 | 1,597 | 2,276 | 3,426 | 5,490 |
| 1991 | 7,499 | 7,400 | 5,761 | 3,131 | 2,231 | 1,829 | 1,640 | 1,708 | 1,837 | 2,454 | 4,304 | 6,158 |
| 1992 | 7,343 | 6,834 | 5,069 | 4,205 | 2,436 | 2,016 | 1,838 | 1,681 | 1,933 | 2,368 | 3,963 | 6,846 |
| 1993 | 7,296 | 7,526 | 7,354 | 4,605 | 2,613 | 1,992 | 1,884 | 1,811 | 1,992 | 2,565 | 4,648 | 6,470 |
| 1994 | 9,690 | 8,292 | 6,078 | 3,993 | 2,609 | 2,117 | 2,056 | 2,011 | 2,008 | 2,582 | 3,532 | 5,793 |
| 1995 | 8,367 | 8,306 | 5,891 | 3,131 | 2,348 | 2,023 | 1,917 | 2,079 | 2,002 | 2,582 | 4,908 | 7,681 |
| 1996 | 9,972 | 9,287 | 7,255 | 5,317 | 2,682 | 2,145 | 1,962 | 1,979 | 2,354 | 2,830 | 5,116 | 7,599 |
| 1997 | 9,063 | 9,260 | 5,557 | 4,176 | 3,154 | 2,350 | 1,943 | 1,921 | 2,078 | 2,652 | 5,014 | 7,949 |
| 1998 | 8,298 | 7,821 | 6,814 | 4,490 | 3,003 | 2,503 | 2,365 | 2,215 | 2,390 | 2,520 | 4,053 | 5,924 |
| 1999 | 10,471 | 6,527 | 6,598 | 4,361 | 2,508 | 2,477 | 2,191 | 2,187 | 2,484 | 2,925 | 3,943 | 5,899 |
| 2000 | 10,257 | 8,901 | 4,660 | 3,747 | 2,499 | 2,079 | 1,807 | 1,840 | 2,244 | 2,438 | 4,436 | 8,458 |
| 2001 | 12,356 | 8,201 | 6,367 | 4,673 | 2,359 | 2,065 | 2,068 | 1,817 | 2,066 | 2,395 | 3,807 | 4,836 |
| 2002 | 9,043 | 7,747 | 6,746 | 4,469 | 2,654 | 2,336 | 1,869 | 1,912 | 2,137 | 2,370 | 4,289 | 8,138 |
| 2003 | 9,595 | 10,236 | 7,187 | 3,838 | 3,038 | 2,518 | 2,296 | 2,282 | 2,385 | 2,913 | 3,652 | 6,637 |
| 2004 | 9,265 | 9,384 | 6,872 | 4,482 | 3,083 | 2,305 | 2,289 | 2,188 | 2,291 | 2,562 | 3,153 | 6,328 |
| 2005 | 8,661 | 8,057 | 6,950 | 4,738 | 2,875 | 2,390 | 2,209 | 2,158 | 2,314 | 2,584 | 3,944 | 7,386 |
| 2006 | 7,918 | 7,538 | 6,670 | 3,903 | 2,569 | 2,448 | 2,162 | 2,184 | 2,311 | 2,815 | 4,521 | 6,500 |
| 2007 | 7,768 | 9,323 | 6,579 | 3,879 | 2,821 | 2,508 | 2,121 | 2,044 | 2,094 | 2,403 | 3,656 | 5,860 |
| 2008 | 8,301 | 8,332 | 7,155 | 4,274 | 2,759 | 2,242 | 2,087 | 1,925 | 2,112 | 2,785 | 4,576 | 7,546 |
| 2009 | 9,139 | 7,710 | 6,073 | 3,763 | 2,587 | 2,120 | 2,252 | 1,967 | 2,243 | 3,082 | 3,743 | 7,202 |
| 2010 | 9,815 | 9,200 | 7,252 | 3,553 | 2,245 | 2,041 | 1,878 | 1,725 | 1,962 | 2,803 | 4,470 | 9,249 |
| 2011 | 10,306 | 7,040 | 5,327 | 3,162 | 2,501 | 1,975 | 1,985 | 2,093 | 2,239 | 3,725 | 4,764 | 7,039 |
| 2012 | 7,343 | 6,034 | 3,063 | 2,821 | 2,015 | 2,005 | 1,825 | 2,036 | 2,114 | 3,522 | 5,564 | 6,587 |
| 2013 | 8,381 | 7,095 | 7,009 | 3,523 | 2,599 | 2,026 | 2,077 | 2,050 | 2,155 | 3,408 | 5,361 | 8,206 |
| 2014 | 11,570 | 8,314 | 6,578 | 3,201 | 2,175 | 2,029 | 2,106 | 2,145 | 2,244 | 3,370 | 6,111 | 7,591 |
| 2015 | 9,901 | 10,806 | 5,638 | 2,928 | 2,453 | 2,141 | 2,040 | 2,057 | 2,225 | 3,033 | 4,635 | 5,192 |
| 2016 | 9,783 | 7,279 | 4,180 | 2,854 | 2,522 | 1,945 | 1,948 | 1,957 | 2,049 | 2,548 | 4,716 | 8,028 |
| 2017 | 7,134 | 5,140 | 5,230 | 2,505 | 2,559 | 2,122 | 2,050 | 2,120 | 2,387 | 3,317 | 5,610 | 8,867 |
| 2018 | 11,381 | 6,317 | 6,250 | 4,623 | 2,622 | 2,428 | 2,256 | 2,077 | 2,286 | 3,537 | 6,720 | 8,171 |
| 2019 | 10,262 | 6,529 | 6,683 | 3,116 | 2,438 | 2,374 | 2,336 | 2,171 | 2,404 | 3,242 | 7,639 | 7,723 |
| 2020 | 8,616 | 8,056 | 4,667 | 3,385 | 2,351 | 2,181 | 2,172 | 2,262 | 2,333 | 3,007 | 4,704 | 8,832 |
| 2021 | 9,995 | 10,263 | 5,496 | 4,294 | 3,221 | 2,575 | 2,445 | 2,392 | 2,711 | 3,594 | 5,778 | 5,803 |
| 2022 | 11,099 | 8,112 | 5,791 | 3,964 | 2,604 | 2,390 | 2,245 | 2,440 | 2,663 | 4,176 | 6,569 | 8,434 |
| 2023 | 8,047 | 6,902 | 6,064 | 3,620 | 2,737 | 2,496 | 2,312 | 2,555 | 2,707 | 3,991 | 5,050 | 7,073 |
| 2024 | 10,865 | 5,688 | 5,893 | 4,390 | 3,320 | 2,641 | 2,493 | 2,395 | 3,085 | 3,859 | 4,859 | 7,721 |
| 2025 | 11,337 | 8,929 | 6,075 | 4,020 | 3,269 | 3,005 | 2,582 | 2,758 | 2,836 | 4,007 | 6,218 | 9,539 |
| 2026 | 11,950 | 7,921 | 4,956 | 3,337 | ||||||||
| - = No Data Reported; -- = Not Applicable; NA = Not Available; W = Withheld to avoid disclosure of individual company data. |
| Release Date: 6/30/2026 |
| Next Release Date: 7/31/2026 |