|
Download Data (XLS File) |
|
||||||||
|
||||||||
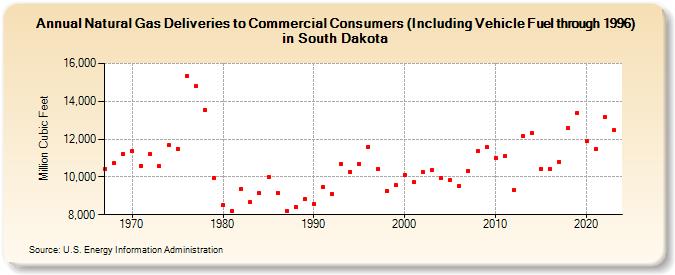
| Natural Gas Deliveries to Commercial Consumers (Including Vehicle Fuel through 1996) in South Dakota (Million Cubic Feet) | ||||||||
| Decade | Year-0 | Year-1 | Year-2 | Year-3 | Year-4 | Year-5 | Year-6 | Year-7 | Year-8 | Year-9 |
|---|---|---|---|---|---|---|---|---|---|---|
| 1960's | 10,444 | 10,723 | 11,201 | |||||||
| 1970's | 11,361 | 10,592 | 11,204 | 10,568 | 11,671 | 11,488 | 15,344 | 14,786 | 13,547 | 9,951 |
| 1980's | 8,507 | 8,188 | 9,384 | 8,651 | 9,128 | 9,987 | 9,166 | 8,199 | 8,396 | 8,826 |
| 1990's | 8,555 | 9,473 | 9,122 | 10,696 | 10,274 | 10,685 | 11,598 | 10,422 | 9,264 | 9,564 |
| 2000's | 10,119 | 9,711 | 10,258 | 10,375 | 9,958 | 9,819 | 9,525 | 10,337 | 11,362 | 11,563 |
| 2010's | 11,025 | 11,101 | 9,330 | 12,151 | 12,310 | 10,434 | 10,439 | 10,813 | 12,573 | 13,405 |
| 2020's | 11,880 | 11,462 | 13,168 | 12,537 | 11,810 | 12,768 |
| - = No Data Reported; -- = Not Applicable; NA = Not Available; W = Withheld to avoid disclosure of individual company data. |
| Release Date: 6/30/2026 |
| Next Release Date: 7/31/2026 |